
Despite its flaws, value-added tax (VAT) remains one of the least distortionary ways to raise revenue. For South Africa, the alternatives – cutting spending on education, healthcare or infrastructure, or taking on more debt – come with a high risk of being worse, economic historian Johan Fourie cautioned in a recent Our Long Walk newsletter.
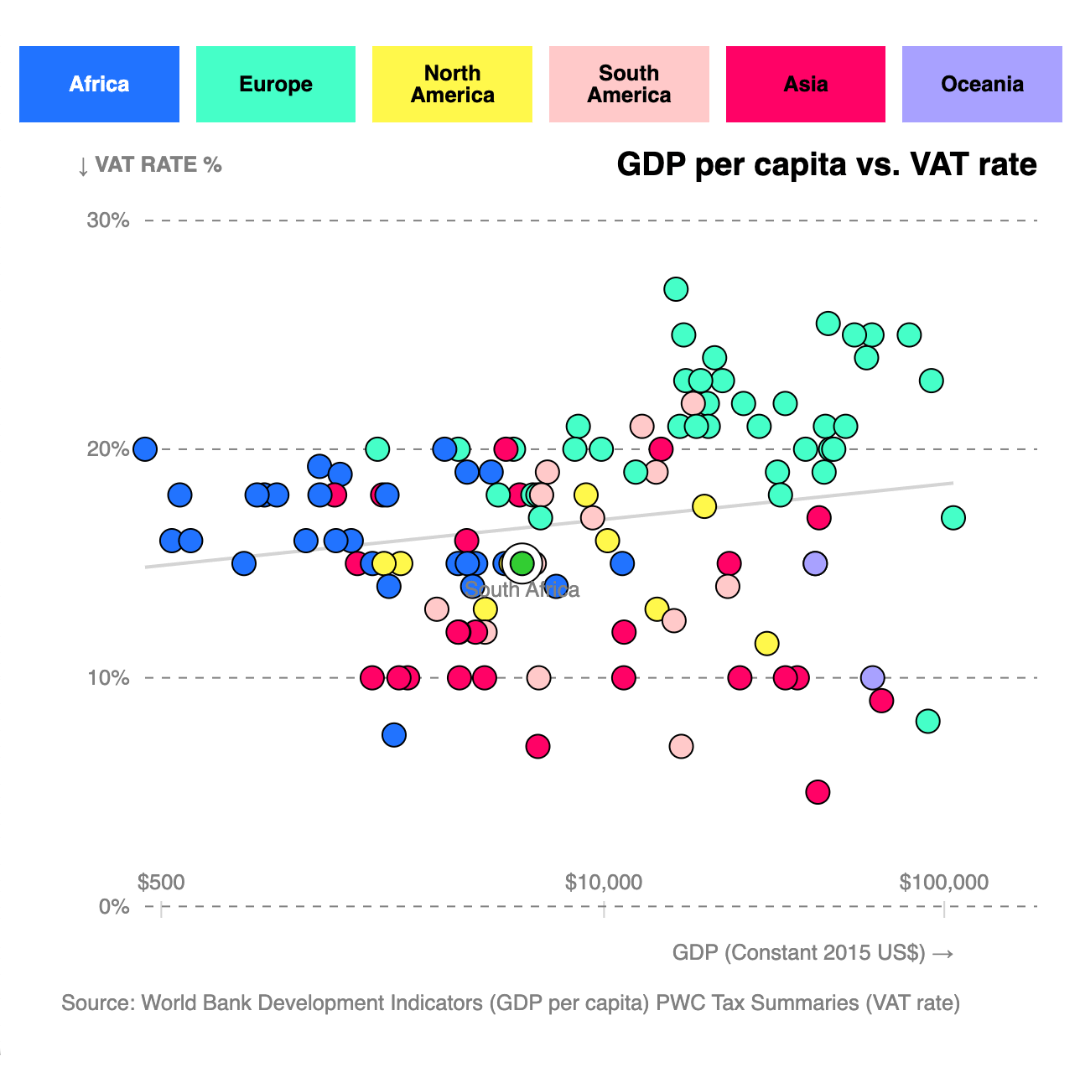
VAT has been adopted in more than 170 countries and generates almost 30% of global tax revenue – especially in countries with large informal economies, Fourie explains in his post, VAT up, doc? He plots VAT rates in a number of countries against GDP per capita to show that South Africa’s current rate of 15% aligns closely with global norms for economies at a similar income level.
We were inspired to create an interactive version of the chart Fourie includes in his post. Using VAT rates for 120 countries based on a PwC tax summaries list, our chart shows that European countries have the highest rates, with Hungary topping the global list at 27%.
The Scandinavian countries – Norway, Sweden, Denmark and Finland – all charge 25% or more. Only two non-European countries have a VAT rate higher than 20%: Uruguay (22%); and Argentina (21%).
VAT was introduced in South Africa at 10% in September 1991 and has been increased twice since then: to 14% in April 1993 and to 15% in April 2018. A proposed increase to 17% failed to get approval from all the parties in the cabinet last week and was the reason for the Budget speech being rescheduled to 12 March.