📚 Mind the gap
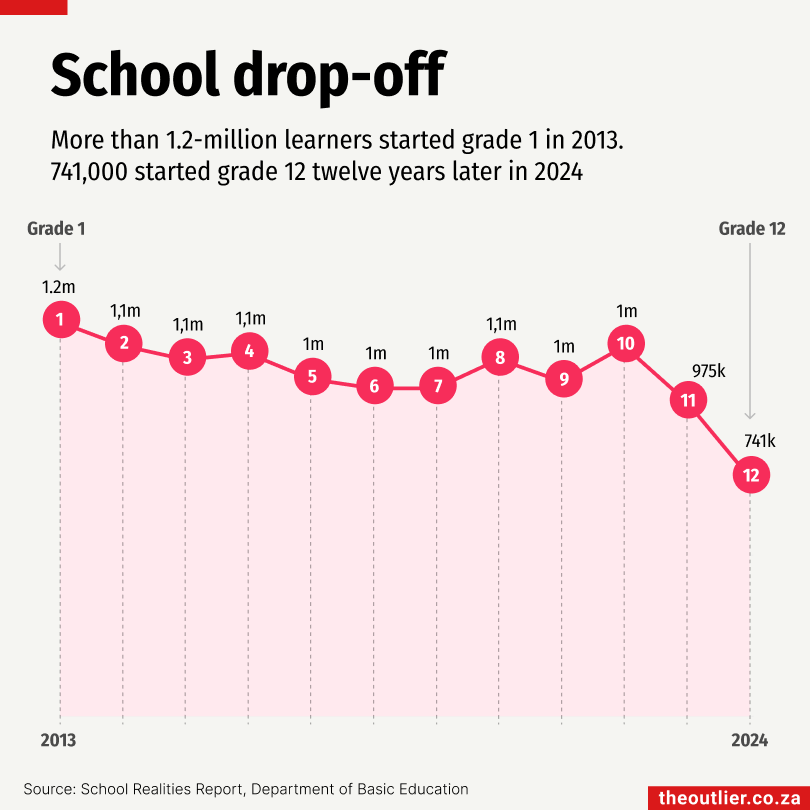
At the end of last year we published our latest feature on the challenges of literacy in South African schools. And on Tuesday the 2025 Matric results will be released.
This time of year education is very much in focus, particularly the gap between the number of learners who start grade 1 and the number who finally sit for the end-of-grade-12 exams. Typically around 1.1m learners enter grade 1 at the start of each school year. And 12 years after that around 750,000 leaners register for the grade 12 matric examinations.
Those learners may not be lost to the education system entirely: they could have repeated a grade or two, moved to a private school, left the country. But how do we know?
🔋7GW
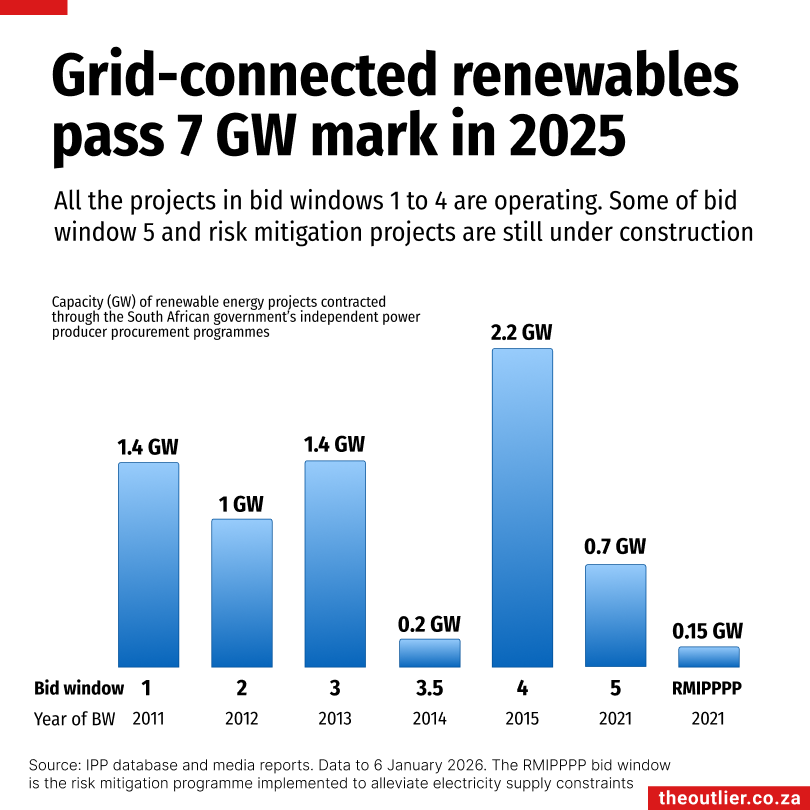
Yesterday we sent out the first edition of Outlier Renew for 2026 with a massive roundup of renewable developments in the past few weeks. It’s been a busy period that has seen government-contracted renewable projects connected to the grid surge past 7GW of capacity. We also looked at coal-for-energy use. Despite the significant increase in renewables connected to the grid, South Africa is still one of the top coal users in the world.
 Hidden cost of downtime
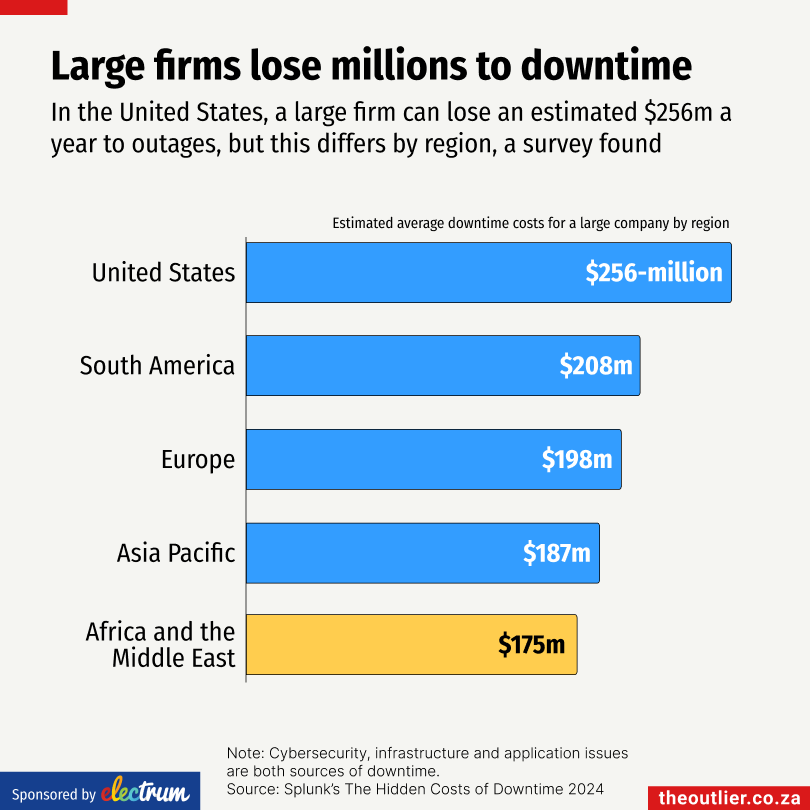
When companies’ systems go offline, the financial losses add up quickly from lost revenue and productivity to regulatory fines, legal costs, and ransomware payouts. On average, downtime costs a large firm $200-million a year, according to US-based software company Splunk, which examined the hidden costs of system outages among the Forbes’ Global 2,000, a list of the world’s largest companies.
In 56% of cases, downtime was caused by cybersecurity incidents, while the remaining 44% stemmed from application or infrastructure failures, such as software failures.
“Most of the time, cyberattacks happen because you are not keeping up with the evolving technologies and the threats it brings to your business,” explained Mauli Tikkiwal, an IT director and board member at a multinational manufacturing company, in the Splunk report “The Hidden Cost of Downtime”.
The cost of downtime also varies by region. A large company based in Africa or the Middle East is estimated to lose $175-million annually to downtime, while a comparable company in the United States faces losses of about $256-million.
On average, large firms in Africa and the Middle East paid $22-million on ransomware payouts and $12-million on extortion payouts from ransomware attacks.
- Produced by The Outlier in partnership with Electrum, the next-generation payments software company, powering payments for banks and retailers.
 Congested schools
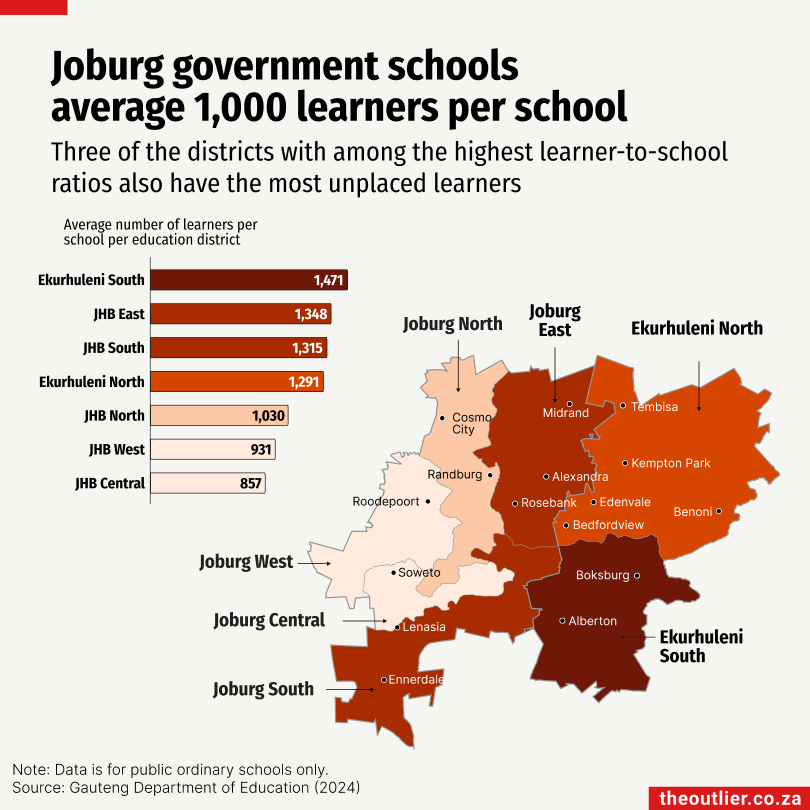
Almost 5,000 grade 1 and grade 8 learners had not been placed in Gauteng schools the week before the 2026 school year was due to begin. The pressure is heavily concentrated in just three school districts – Ekurhuleni North, Ekurhuleni South and Joburg East – which together account for 84% (4,095) of all unplaced learners.
To understand why placement pressures are so severe in these areas, we analysed the Gauteng Department of Basic Education’s headcount statistics for 2024. We worked out the average number of learners per government school in each education district. The three districts with the most unplaced learners also had among the highest numbers of learners per school on average.
Take Ekurhuleni South, for example, which has the highest learner-to-school ratio. It has an average of 1,359 learners per primary school and 1,683 per high school. If you break that down by grade, the average number of learners per grade in the primary schools is 170 (grades R to 7) and 337 per grade in the high schools. Even at 40 learners per class, that would mean a high school would need eight classes per grade to accommodate all its learners.
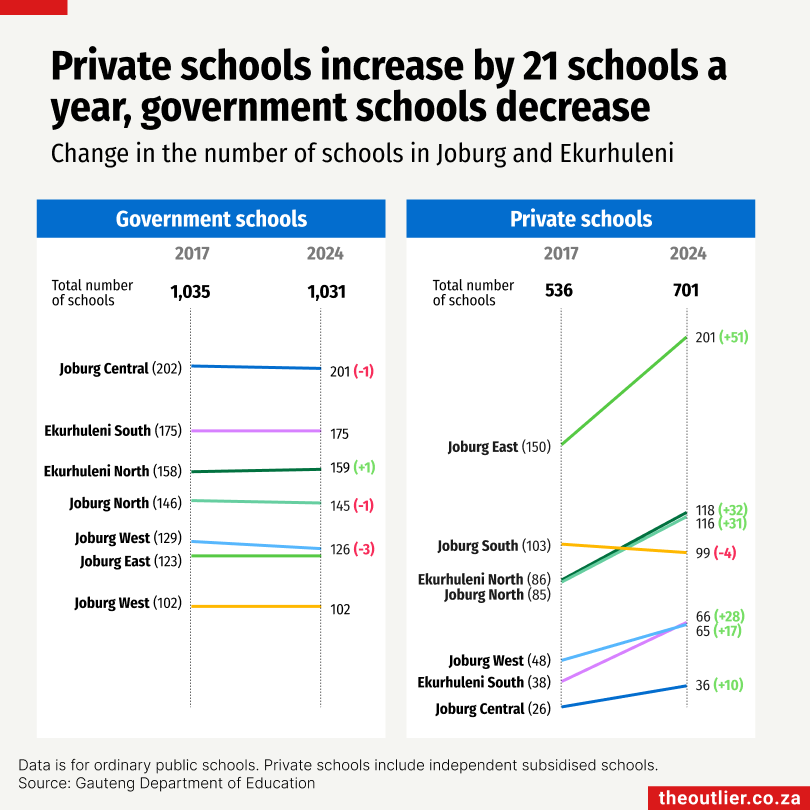
It’s no surprise that the department struggles to place learners every year. Nor is it coincidental that Johannesburg and Ekurhuleni have 701 private and independent schools. This number grew by 165 between 2017 and 2024 – which is a cracking pace of around 21 new schools a year.
In comparison, one new public school was built over the same eight-year period. But five schools were closed for reasons like dolomitic instability and sinkhole formation, as well as low learner enrolment. So there were actually four fewer public schools in 2024 than there were in 2017, even though the number of learners increased by just over 173,000 over that period.
We decided to look at a different source – the Gauteng school master list (2024), which is on the Department of Basic Education’s website – to see how big the high schools in Joburg and Ekurhuleni are. There are 44 schools with more than 2,000 learners, but the average number of learners per school is 1,400.
The schools in poorer areas (quintile 1 to 3 schools) have a higher average number of learners than those in better-off areas (quintile 4 and 5 schools): 1,524 compared with 1,355. That’s 169 more learners per school on average.
Quintile 1 to 3 schools are the so-called ‘no-fee’ schools and quintile 4 and 5 schools are fee-paying schools. Interestingly, there are more fee-paying schools (182) than no-fee schools (122) in Joburg and Ekurhuleni, according to the school masterlist.
| Quintile | Number of high schools | Number or learners | Average number of learners per school |
|---|---|---|---|
| 1 | 23 | 38,923 | 1,692 |
| 2 | 38 | 66,854 | 1,759 |
| 3 | 61 | 80,163 | 1,314 |
| 4 | 65 | 92,229 | 1,419 |
| 5 | 117 | 154,319 | 1,319 |
| Total | 304 | 432,573 | 1,423 |