
👩🏾🎓 Employment
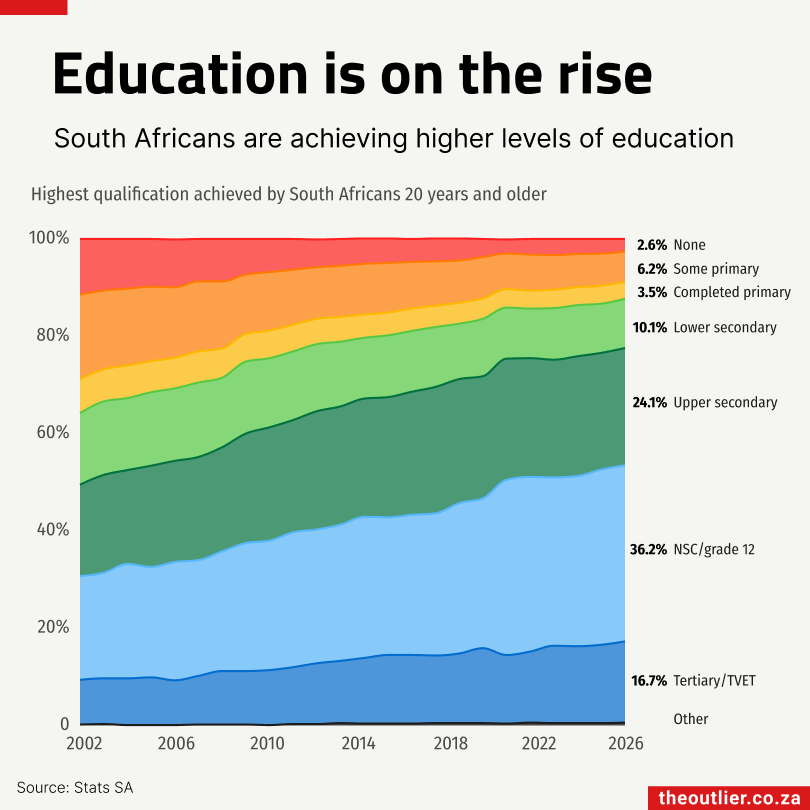
In the past two decades, education in South Africa has slowly been changing. Adults are reaching higher levels of education than ever before. Which is mostly good news given the clear correlation between education level and finding a job (see below and this week’s feature).
In 2002, 24.4% of South Africans over the age of 20 had only completed a grade 7 or below, while 11.4% had no formal education at all. Very few people had post-school qualifications (9.2%). However, those trends have gradually been changing with more people gaining access to education and completing higher levels of study. In 2025, only 2.6% of people had no formal education, and 9.7% had a grade 7 or below.
Degrees of difference
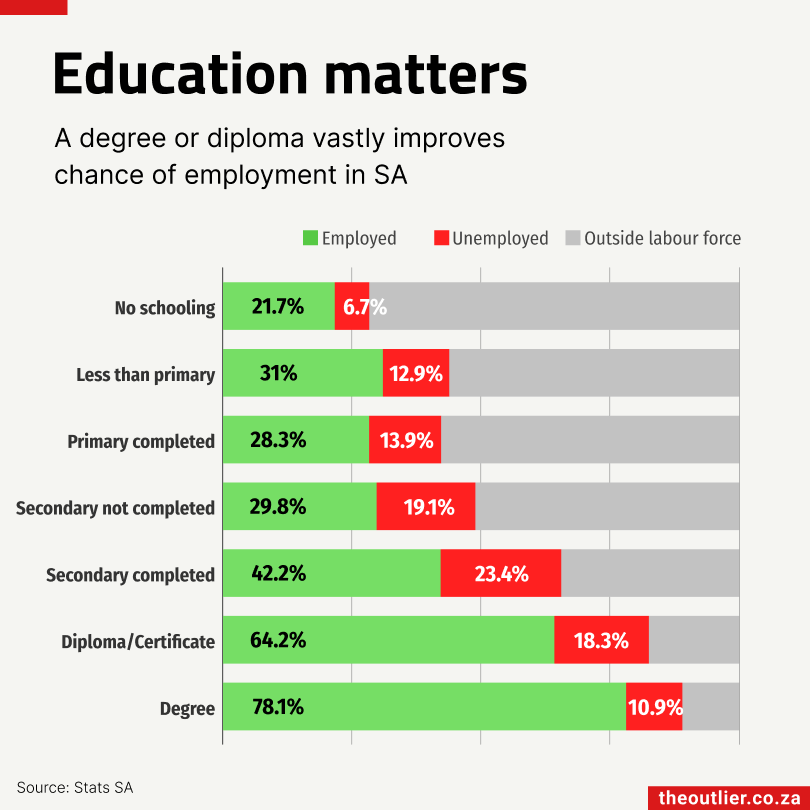
The standard unemployment rate in South Africa is calculated using only people actively seeking work. A more interesting picture comes from the employment-to-population ratio (aka the labour absorption rate), which looks at how many working-age adults have a job. Of every 100 adults who have a degree, 78 are employed, 11 are unemployed and seeking work and 11 are outside the labour force (ie, they aren’t available to work or they aren’t looking for a job). For diploma and certificate holders the picture is 64 employed, 18 unemployed, and 18 outside the labour force. The further down the education ladder, the smaller the employed share and the larger the group that is considered to be outside the labour force.
Every step up the education ladder adds at least 12 percentage points to employment. The biggest single jump, 22 points, is from matric to diploma. Not completing secondary school: 30% employed. Completing matric: 42%. A diploma or certificate: 64%. A degree: 78%.
In this week’s feature we take a closer look at the connection between education level and employment status.
🏠 The company mapping every building in South Africa
For 27 years, GeoTerraImage has been quietly building one of the most comprehensive spatial datasets in the country. More than 32-million buildings catalogued, 90 different classifications, and updates running on an annual cycle rather than a 10-year census rhythm.

Senior geospatial specialist Ross Solomons joined The Outlier’s Out to Lunch webinar to walk through what the Pretoria-based company does, who uses its data, and why spatial information is becoming harder to escape.
Read the summary story here. Outlier members can also watch the full recording here.
🚨 Kidnapping rise
Johannesburg is averaging 11 kidnappings a day.
In the first three months of 2026, police in Johannesburg recorded 971 kidnappings, the highest of any district in South Africa.
The problem is deeply concentrated. Ten precincts account for 44% of Johannesburg’s cases, with five of them, Protea, Eldorado Park, Moroka, Ennerdale and Lenasia, located south of the city.
The concentration in lower-income areas is telling. Private investigator Kyle Condon told The Outlier that lower-income earners “are obviously far easier targets and do not draw as much media attention or dedicated police response.”
It’s worth noting what “kidnapping” covers here. The police definition includes not just ransom scenarios but also extortion or trafficking. Forcing someone to drain their bank account before releasing them counts.
Criminologist Professor Jacob Mofokeng told EWN that kidnapping in Gauteng has become “a highly sophisticated, volume-driven commercial enterprise,” with syndicates treating people as “the most liquid asset in the criminal economy.”
Produced in partnership with Our City News.
🚨 Murders
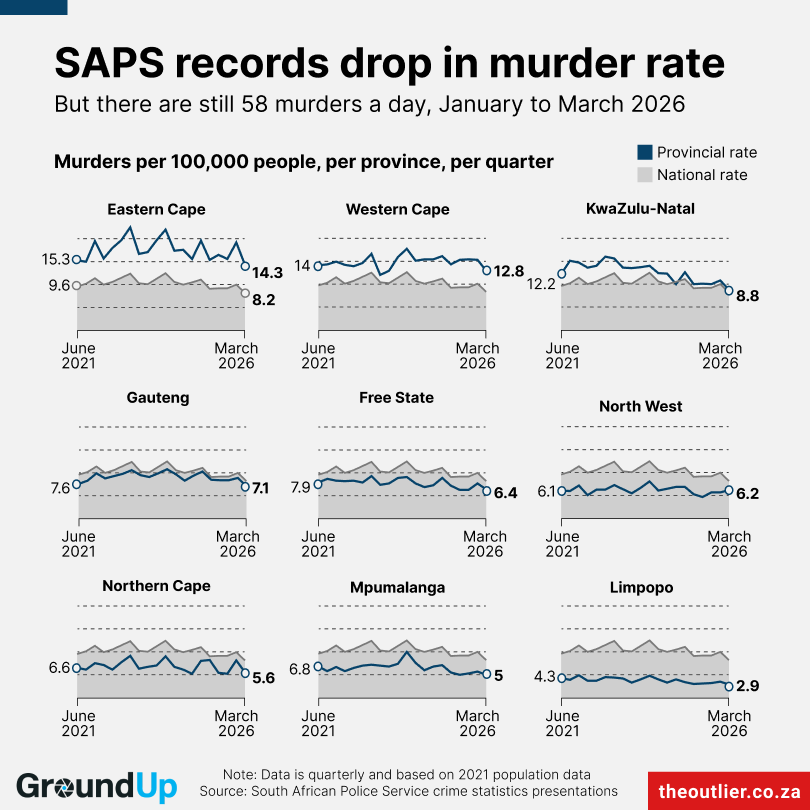
The number of murders recorded by the South African Police Service (SAPS) has declined every quarter for the past three years. Over the twelve months to March 2026, the murder rate fell to 36.6 per 100,000 people, down from 40.7 the year before.
The decline it important but still no cause for celebration. The average murder rate across Africa is about 12.7 per 100,000. Internationally, it’s about 5.6. South Africa’s rate is nearly three times the continental average and more than six times the global one.
Between January and March, 5,181 people were murdered, 58 people every day with four provinces making up the majority:
- 1,223 in Gauteng
- 1,058 in KwaZulu-Natal
- 983 in Western Cape
- 949 in Eastern Cape
- 253 in Mpumalanga
- 271 in North West
- 192 in Free State
- 175 in Limpopo
- 77 in Northern Cape
Most murders took place in public spaces (2,587) or in the homes of a perpetrator or victim (1,523). Another 160 occurred at liquor outlets.
Read the full GroundUp article here.
Click here for a link to all references for this newsletter.