Delivering toxic water to your town is not just a spectacular own-goal on the eve of an election; it also smells strongly of maladministration spilled over into criminal negligence.
Or so we thought until we started examing the chain of events which, it emerges, began much further upstream from the unsanitised water delivered to the citizens of Bronkhorstpruit this week.
Two newsletters back we highlighted the decline in water quality across all the metros, including Tshwane. We still don’t know why these residents weren’t alerted, but this potentially fatal service delivery failure feels like a bitter betrayal of citizens by the state. We can only hope the good people of Bronkhorstpruit will find their voice at the ballot box.
🗳️ Outlier Smart Voting Tools
- Desi, our AI chatbot, answers your plain-English election questions
- BallotBox: Find candidates and how many wards they are standing in
- Find your voting station
🏠 X factors
In local elections voters get more than one ballot paper: a ward ballot for their local / metro municipality and a PR ballot, and if you don’t live in a metro, one for a district council. On the ward ballot you vote for a person to represent your area. On the PR ballot you vote for a party.
The candidate who wins a ward gets a seat on the council, and ward winners make up half the seats. But the total number of seats each party gets is based on its share of all the votes, ward and PR added together. Parties that won fewer wards than their share deserves are topped up with PR seats.
So winning a ward isn’t the only way onto the council. Often it’s easier to run candidates in lots of wards and pick up a few hundred votes in each. Those votes add to the party’s total, and that total turns into seats.
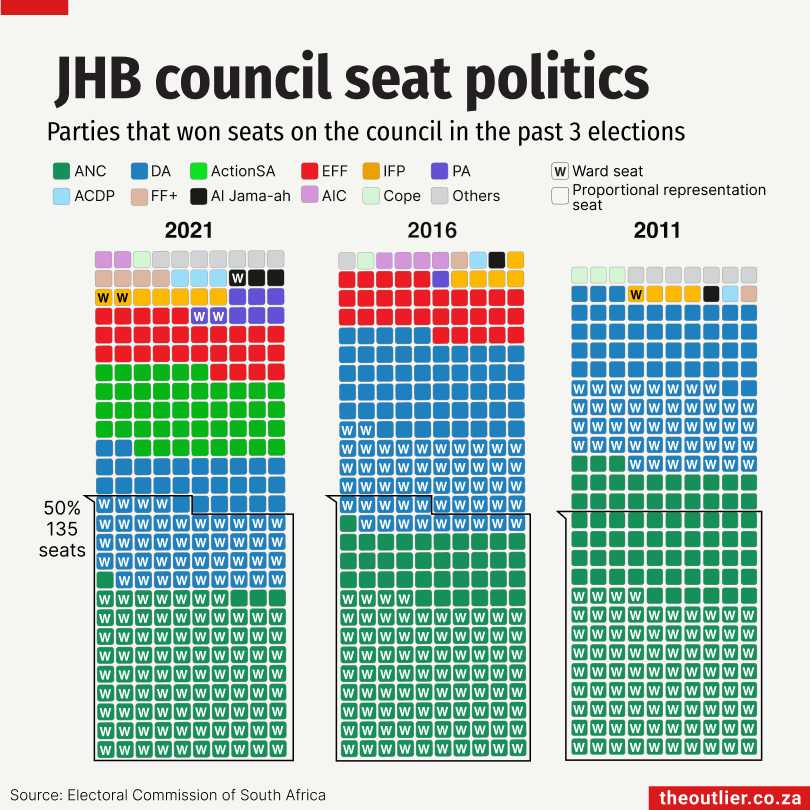
In Johannesburg in 2021, neither ActionSA nor the EFF won a single ward, yet both ended up with a large block of council seats. This year, with some parties putting candidates in every one of the city’s 135 wards, many seats may be won through sheer vote numbers.
The chart shows Johannesburg’s council seats. A “W” marks a seat held by someone who won a ward. The rest were allocated to parties based on their share of the overall vote. It shows how the EFF benefited from this system in 2016 and 2021, and ActionSA in 2021.
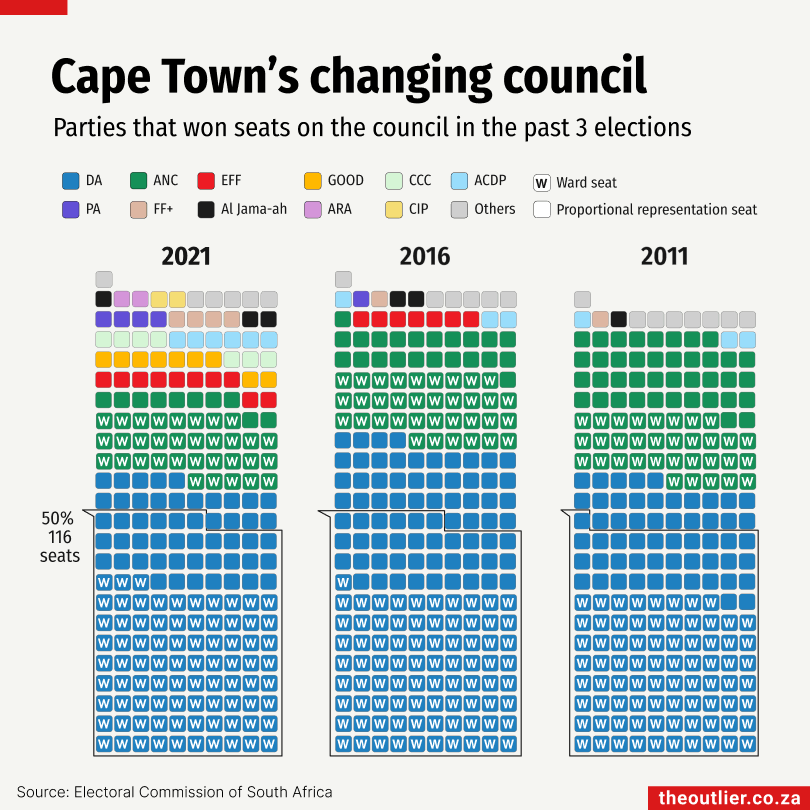
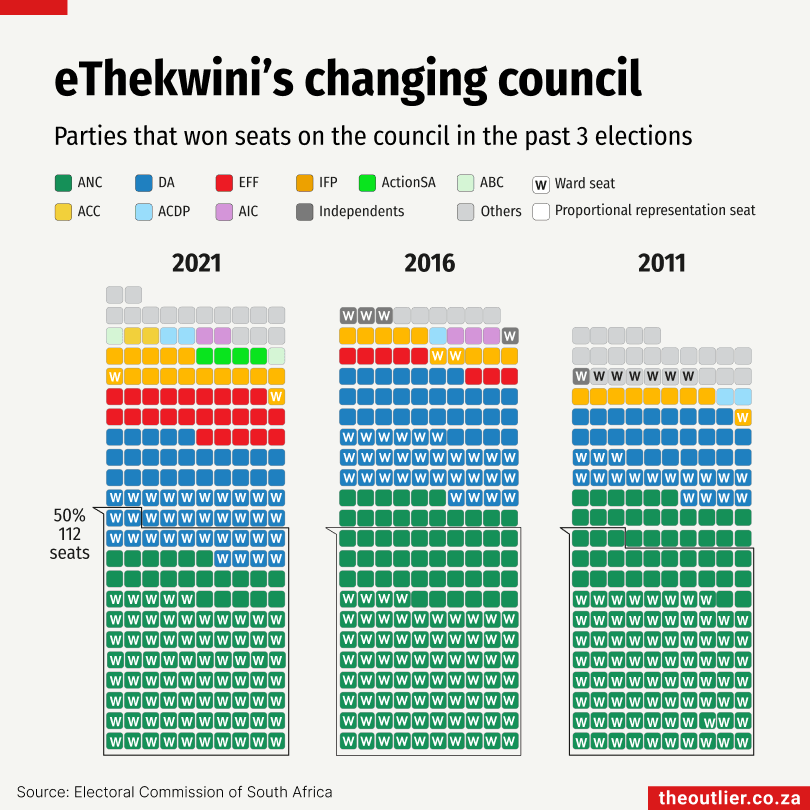
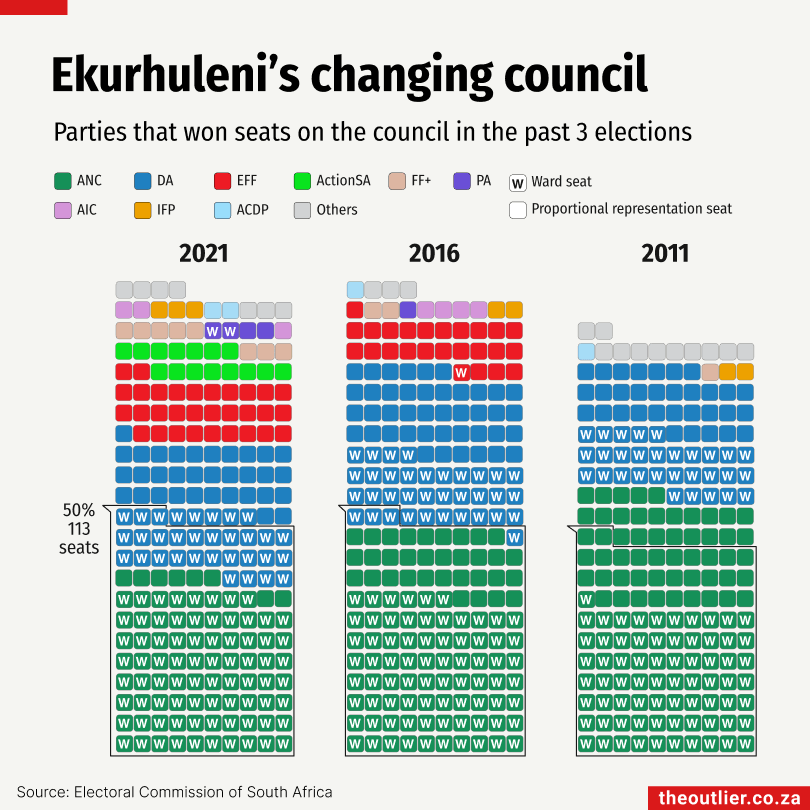
💡Explore the seat allocations for all councils in our Ballot Box tool:
For more election analysis visit our partner The South Africa Brief
🏠 Dirty laundry
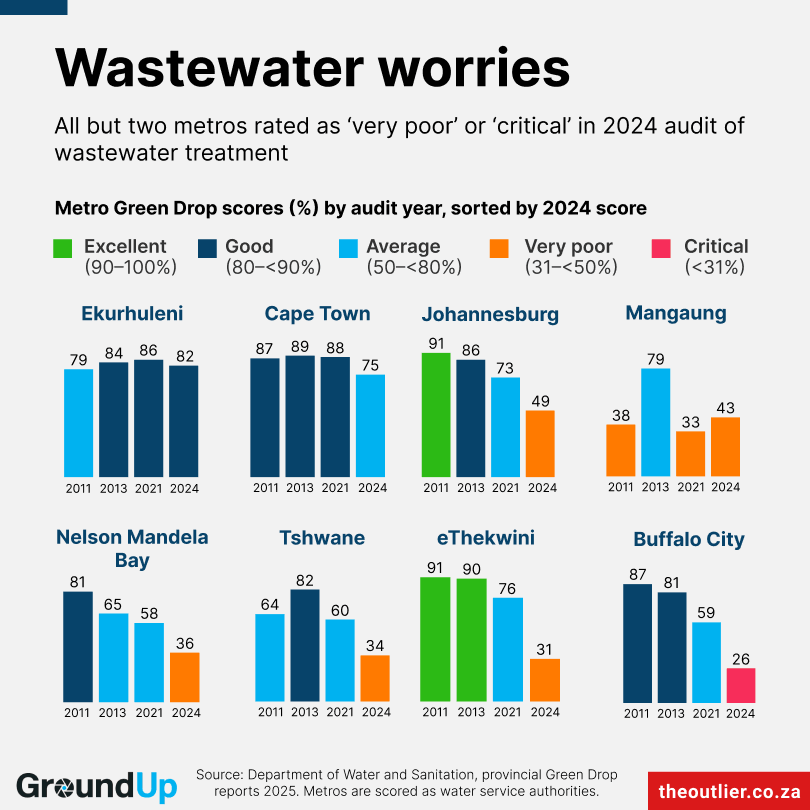
Last month we charted the state of sewage treatment in South Africa’s eight metros with GroundUp. Six of them were rated “very poor” or “critical” in the 2024 Green Drop audit. Tshwane’s score fell from 82% in 2013 to 34%.
That decline now has a human cost. Between 7 and 18 October, 408 people in and around Bronkhorstspruit fell ill, most of them children under four. Investigators traced the cases to tap water.
Two kinds of plant matter here. A water treatment plant cleans river water so people can drink it. A wastewater treatment works cleans sewage before it goes back into a river.
The Bronkhorstspruit water treatment plant draws water from the Bronkhorstspruit River. Officials say the river is badly polluted by sewage from failing works upstream in Victor Khanye municipality and from Tshwane’s broken pump stations. From 24 September to 14 October, the plant had no chlorine after a supplier dispute. Residents were not warned.
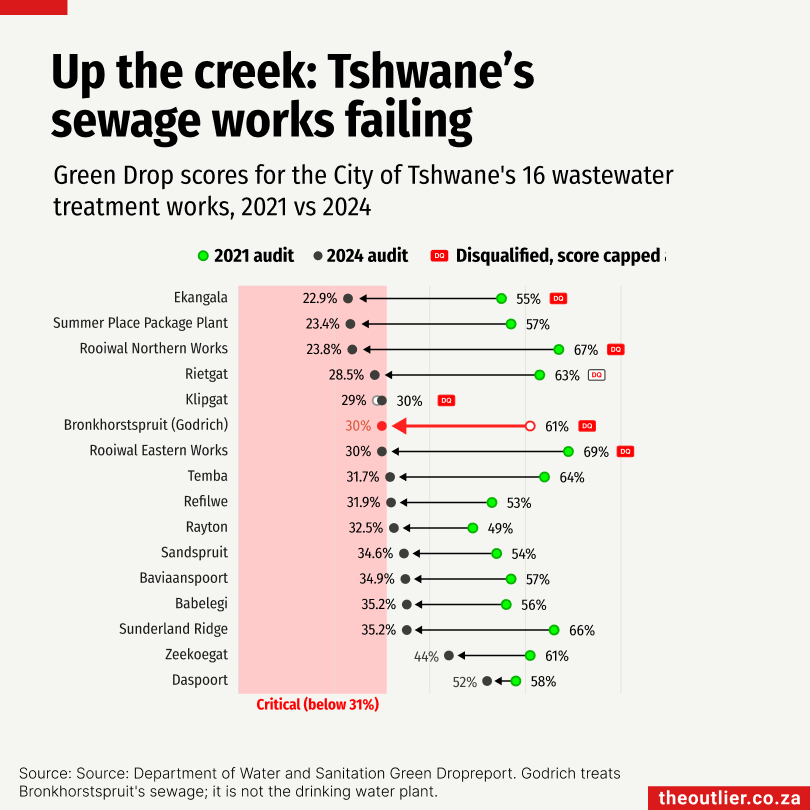
Our chart zooms in on Tshwane’s own 16 sewage works. In the Department of Water and Sanitations Green Drop reports, 15 scored lower in 2024 than in 2021, and seven were considered critical. The Green Drop score of Godrich, which treats Bronkhorstspruit’s sewage, fell from 61% to 30%.
Polluted rivers leave drinking water plants no room for error. In Bronkhorstspruit, chlorine was the last safeguard, and it was missing for three weeks.
👨🏽👩🏽👧🏽👦🏽 Social support
Finance Minister Enoch Godongwana announced on Wednesday that the government will spend just under R290-billion on social grants this financial year. That’s 11% of government spending, the same as 20 years ago.
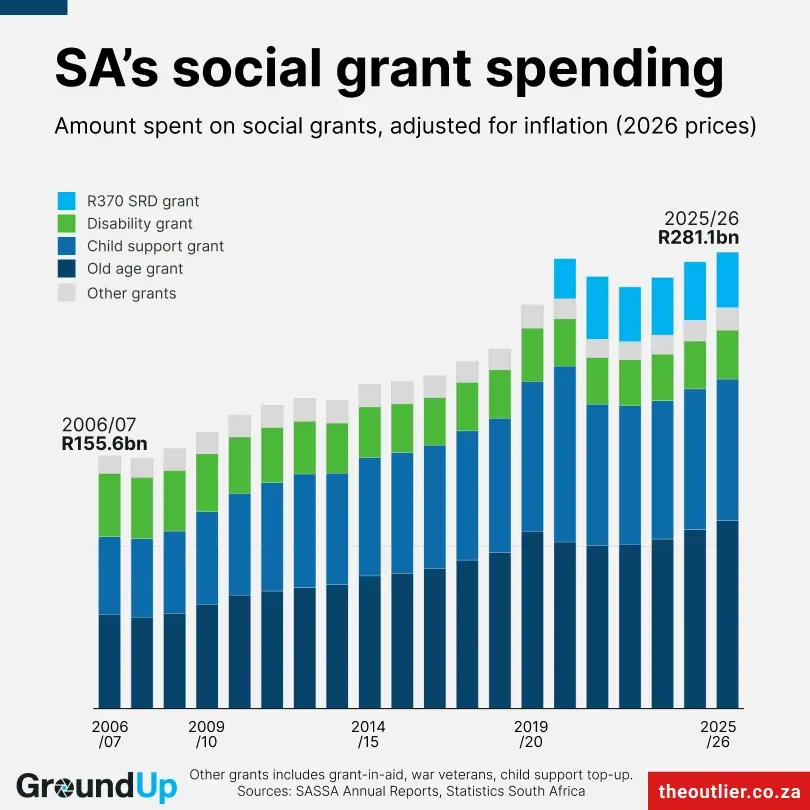
20 years ago, when SASSA began operating, government spent R57-billion on social grants, which is the equivalent of R155.6-billion in today’s money. So when taking inflation into account, spending on social grants will have grown by about 86% between 2006/07 and 2026/27.
But as a percentage of total government spending, social grants expenditure has stayed the same at 11.2% since 2006. It was 2.8% of gross domestic product in 2006/07 and 3.6% in 2025/26.
The number of people receiving grants has doubled over the past twenty years, from 12-million in 2006/07 to about 26.2-million in 2026/27. A quarter of South Africans received a grant then; 40% do today.
One of the fastest periods of growth was between 2009 and 2012, when the child support grant was extended to older children. And the addition of the Covid Social Relief of Distress (SRD) grant, currently valued at R370 a month, added about 8-million people to the grant system.
The SRD grant was intended to provide temporary assistance to people without income during the pandemic. But it has been extended multiple times, most recently on Wednesday until March 2028. It is likely to be replaced by a grant that also helps connect people to job opportunities.
Grant type | Number of beneficiaries | |
|---|---|---|
2006/07 | 2026/27 | |
Old-age grant | 2.2-million | 4.2-million |
Disability grant | 1.4-million | 1.1-million |
Child support grant | 7.9-million | 12.3-million |
Other grants | 0.5-million | 0.4-million |
Total | 12-million | 18-million |
Covid SRD grant | Didn’t exist | 8.2-million (projected) |
Total incl SRD | 12-million | 26.2-million |
But government now expects beneficiary numbers to fall.
According to Treasury’s policy statement published on Wednesday, the number of grant beneficiaries (excluding the SRD grant) is projected to fall to 17.1-million in 2029/30 as verification is tightened, saving R6.2-billion.
Between April and September this year, 300,000 fewer children were receiving the child support grant than were expected to. The number of people who have been receiving the SRD grant this financial year is also about 300,000 less than was projected. Because of this, the government will spend about R3-billion less on social grants this financial year than was previously budgeted for.
Grant values have mostly kept pace with inflation:
Grant type | Monthly grant value | |
|---|---|---|
2006/07 * | 2026/27 | |
Old-age grant | R2,394 | R2,400 |
Disability grant | R2,394 | R2,400 |
Child support grant | R555 | R580 |
Covid SRD grant | Didn’t exist | R370 |
Foster care grant | R1,723 | R1,295 |
* inflation-adjusted, 2026 prices
🙏 Produced in partnership with GroundUp News. Read the full story.
🦈 Bad tidings
On Tuesday morning a 65-year-old, Janine Lochrenberg, was killed by a shark at Orient Beach in the Eastern Cape. She had been swimming with a group when the attack occurred.
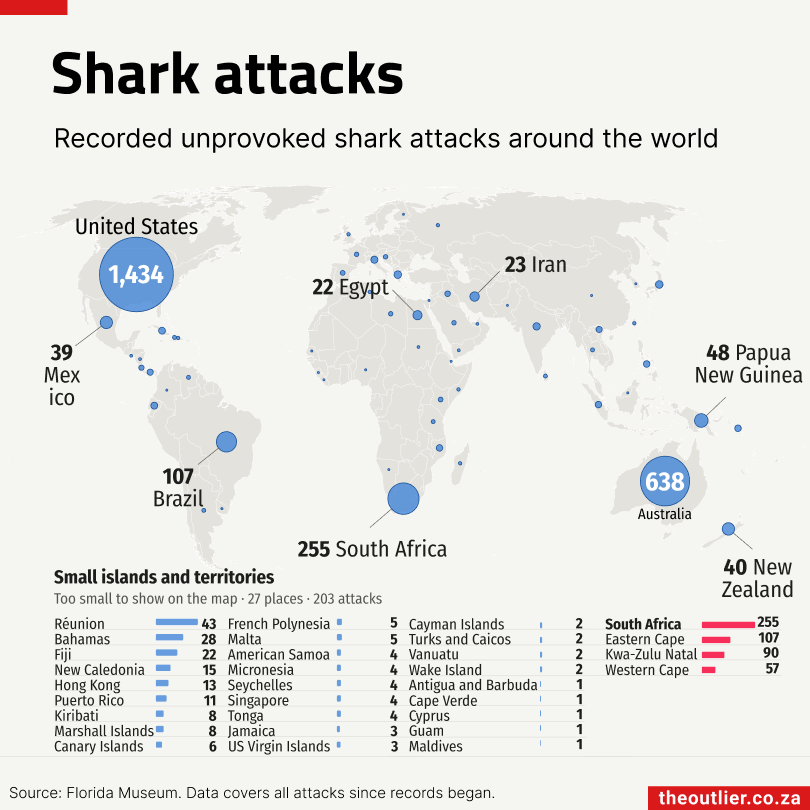
Fatal attacks like this are rare in South Africa. The Florida Museum of Natural History’s International Shark Attack File recorded 29 unprovoked bites in the country between 2012 and 2021, an average of about three a year. Six were fatal.
Three countries around the world account for 75% of unprovoked shark attacks. The United States (1,434 attacks), Australia (638 attacks) and South Africa (255 attacks) together hold 2,327 out of 3,070 total attacks mapped since records began.
One would assume that most shark attacks involved surfers or other board sports, however only 32% of incidents were reported to be related to board sports, while swimmers and waders accounted for 46% and snorkelers/free divers accounted for 15%.