🚗 Gridlock
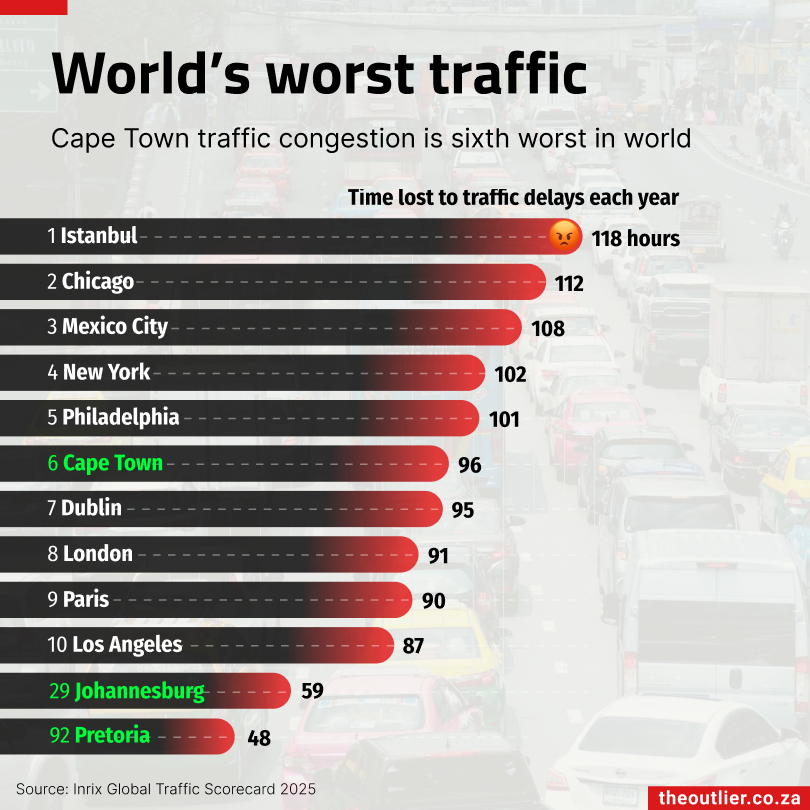
Cape Town retains its top-ten ranking among the cities of the world with the worst traffic congestion. Every year, Inrix, a traffic management company, releases data based on its platform about the cities with the worst traffic jams. The data now covers 36 countries and more than 900 cities. Africa is mostly unrepresented in the data, leaving South Africa as a lone representative.
Istanbul retains its unenviable position as the most congested city, with an estimated 118 hours lost to traffic delays by drivers on average in 2025. This is almost 30% up on the two years ago. The last time I was in Istanbul I was on a bus stuck in traffic. Some of our group got off the bus to walk and arrived back at the hotel long before the bus did. So it’s easy to understand why Istanbul tops the list. It’s one of my favourite cities but the traffic!
Cape Town is another lovely city with a bad traffic problem. Traffic delays in the city are reportedly 16% up on 2023 but just 2% up on 2024. I have only missed a plane once and that was in Cape Town because of traffic, despite leaving for the airport hours ahead of time.
The only cities in the top 10 where traffic delays are reducing are London (down 10% on 2024), Paris (-7%) and Los Angeles (-1%).
📚 Education
Girls are much more likely than boys to reach reading benchmarks set for grades 1,2 and 3, a survey by the Department of Basic Education found.
According to the Funda Uphumelele National Survey, 44% of the girls met or exceeded the reading benchmarks compared with 27% of the boys. At the other end of the scale, 19% of boys scored zero for the reading assessments, compared with 10% of girls.
In next week’s newsletter, we will publish a more detailed report of the reading survey findings, which we did with the support of the Henry Nxumalo Foundation.

👾 Cyber threats
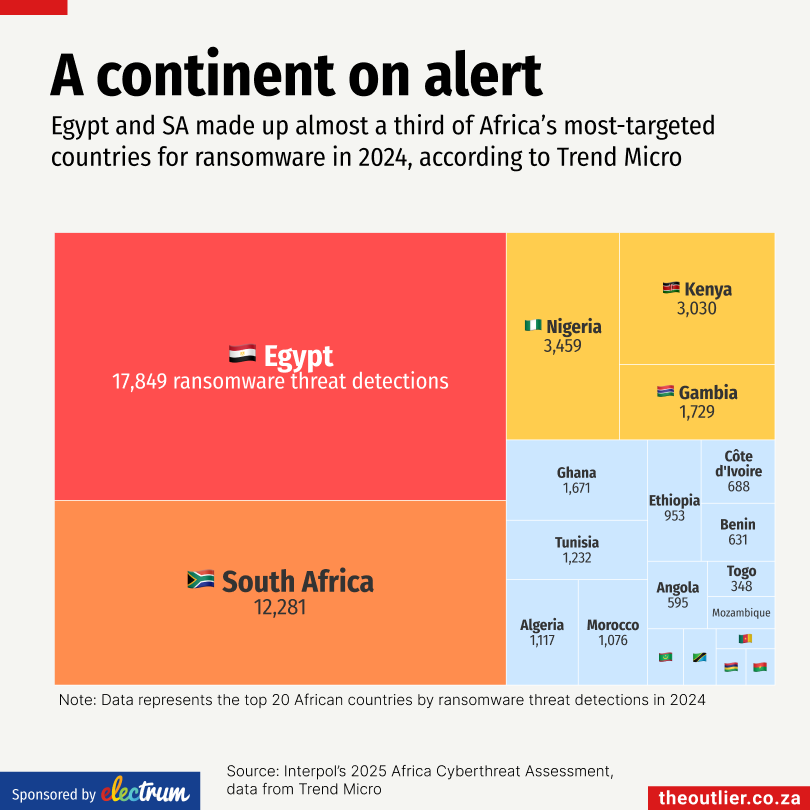
South Africa is not immune to cybercrime. Interpol’s 2025 Africa Cyberthreat Assessment shows that South Africa recorded the second-highest number of ransomware detections on the continent in 2024, behind Egypt. While these numbers are small compared to the United States, which saw more than a million ransomware attacks in 2025, according to Trend Micro, they pose serious risks at home. Ransomware attacks can disrupt critical infrastructure, impose heavy financial losses, and erode trust in affected institutions.
In 2023, South Africa’s Department of Defence lost 1.6TB of data to the ransomware group Snatch. And the threat is evolving. Trend Micro predicts that by 2026, “ransomware will evolve into AI-driven, fully automated operations that scan, exploit, and extort with minimal human input.” This will make previously secure systems more vulnerable: supply chains, open-source components, and AI-enabled workflows could become key entry points. Attackers are also expected to move beyond simply encrypting data toward “intelligent data exploitation,” using AI to identify and target victims’ most sensitive information.
- Produced by The Outlier in partnership with Electrum, the next-generation payments software company, powering payments for banks and retailers.
🔋 Renew
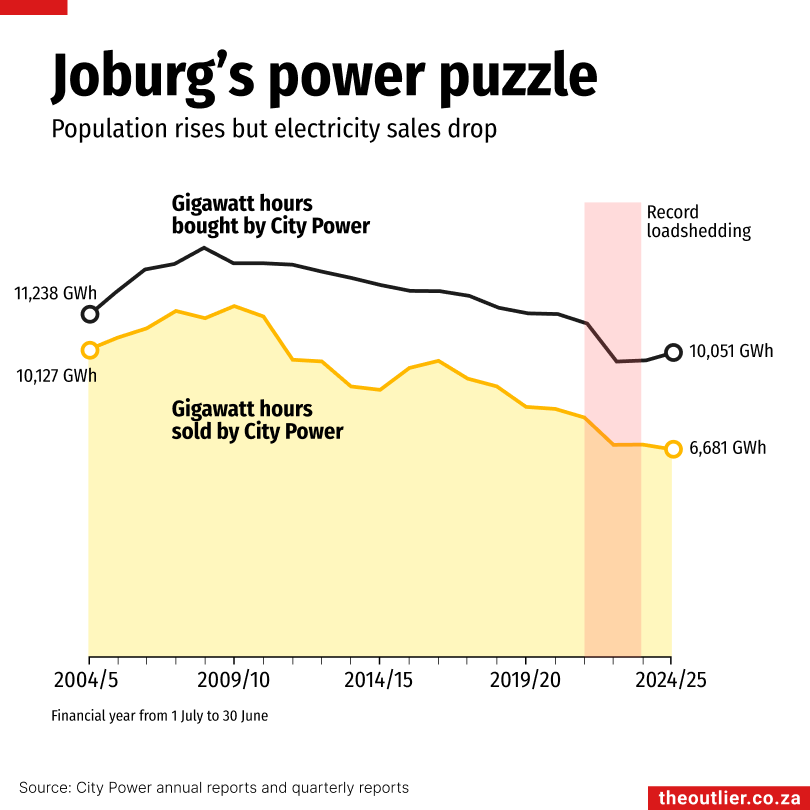
When we heard that Gauteng had 2.2 GW of installed rooftop solar capacity we wondered if this massive off-grid capacity has had an effect on the City of Johannesburg’s electricity sales.
We collected data from City Power’s annual and quarterly reports on the amount of electricity it buys from Eskom in gigawatt hours and the amount it sells to its customers. Sure enough, there has been a decrease in the amount of electricity sold, but the decrease started around 2010 – long before the surge in rooftop solar installations.
The extent of the drop off in sales is also strange given that the city’s population has grown from 4.2-million in 2010 to 5.9-million in 2025, according to StatsSA’s 2025 mid-year estimates.
The gap between the amount of electricity bought from Eskom and the amount sold has also increased. We asked City Power why. Their answers were not what we expected.
Firstly, City Power says it loses nearly 30% (29.87% to be precise) of the electricity it buys from Eskom. The biggest driver of the long-term decline in electricity sales is “non-technical losses”. That’s electricity theft, meter bypassing, illegal connections, and unmetered consumption. Technical losses, caused by ageing infrastructure, overloaded feeders, and unbalanced loads, are also a problem. But it’s non-technical losses that are the main cause of revenue loss, says City Power.
When we asked if rooftop solar had anything to do with the drop-off in the amount of electricity it buys from Eskom, City Power didn’t answer directly but referred to its Sustainable Energy Strategy, which involves diversifying its energy sources.
Our research shows that City Power still buys around 90% of its bulk electricity from Eskom and 10% from Kelvin Power Station in Kempton Park. It also has short-term contracts with four independent power producers (92 MW of capacity in total) and has approved 26 MW of small-scale embedded generation, according to its latest available annual report (2023/2024).
🚜 Land owners
Public debate prompted in part by former US President Donald Trump’s comments on South Africa has centred on whether the country’s laws discriminate against white people. But as GroundUp writes, “White people are doing very well in democratic South Africa.”
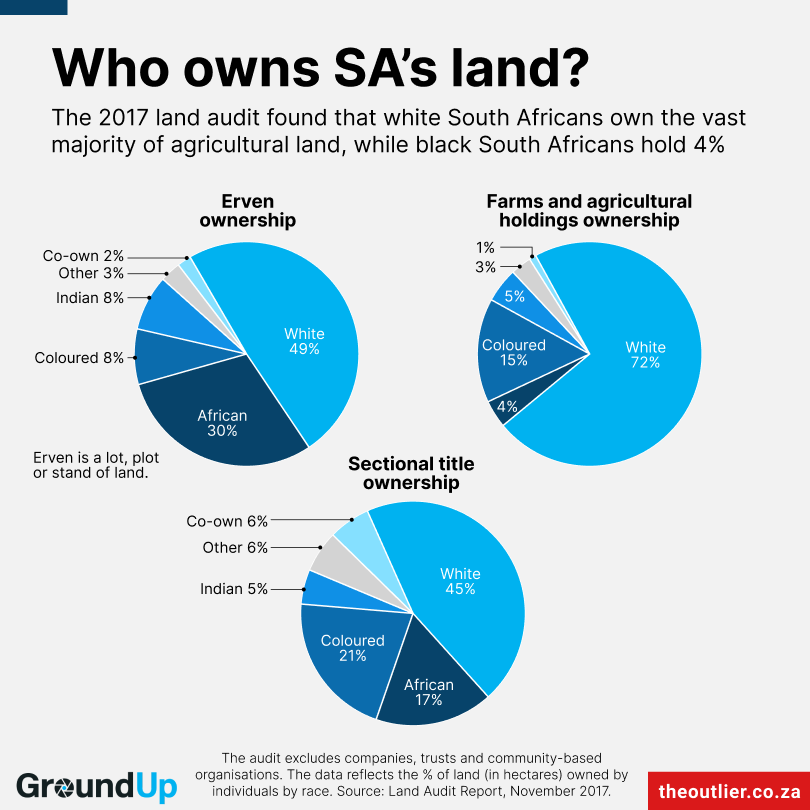
One area where this is clear is land ownership. Although the data is dated, a national land audit conducted by the Department of Rural Development and Land Reform in November 2017 analysed who owns 114-million hectares of registered land in South Africa.
Of this:
- Individuals own 37.8-million ha,
- Trusts own 29.3-million ha,
- Companies own 23.2-million ha, and
- Community-based organisations own 3.5-million ha.
Among individually owned land, white South Africans hold by far the largest share:
- 72% of agricultural land,
- 49% of plots, and
- 45% of sectional title properties.
That’s a substantial property footprint for a group that makes up just 7% of the population.
However, the audit gives only a partial picture: it does not include the racial breakdown of land held by companies, trusts or community organisations.
- Chart produced by The Outlier in partnership with GroundUp. Read the full editorial here.
Click here for a link to all references for this newsletter.