Category: How To
-

Loading non-essential data behind the scenes in Svelte
Streaming promises makes it simple to fetch data without having the page wait for non-essential data requests to complete before starting to render.
-

Remove features from a map with QGIS
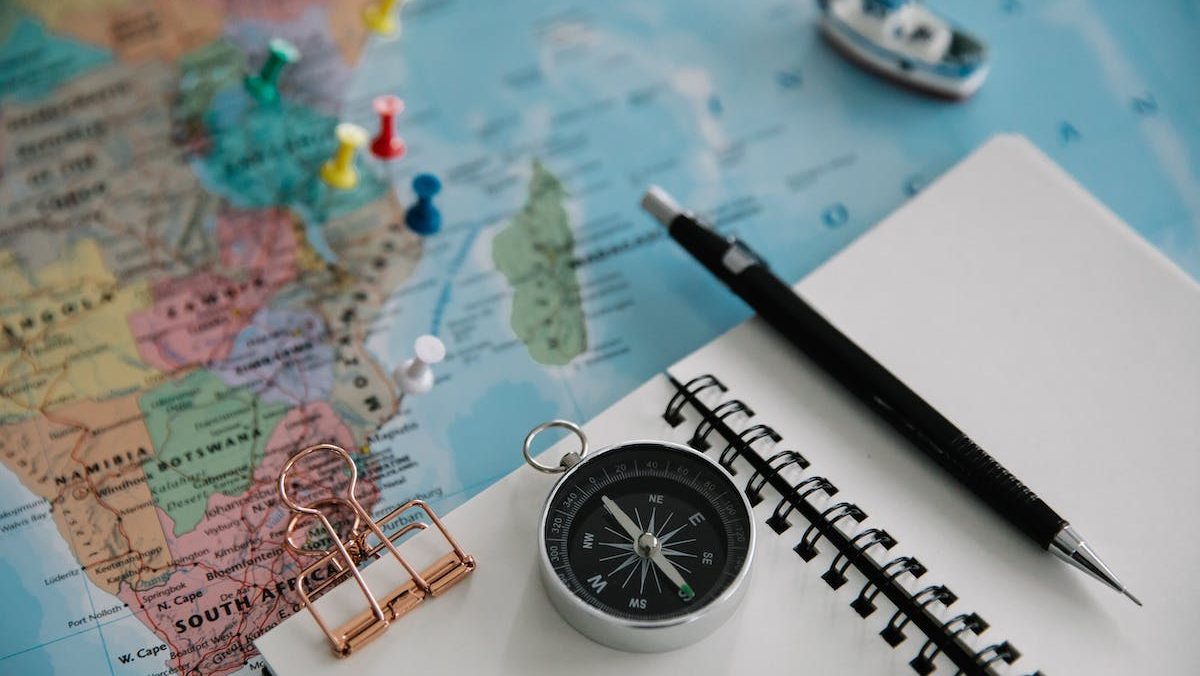
There are two small research islands more than 2,000km off the coast of South Africa. When mapping SA data, you generally don’t want to include them. Luckily, it is simple enough to remove the islands in QGIS.
-

Creating a grid overlay for a map using QGIS
There are a number of reasons you may want to make a grid of points covering a geographic area. In my case, I wanted to work out which point in South Africa was the furthest from a police station.
-

Automating data downloads from a Google spreadsheet
Downloading data from a Google Sheets is usually as easy as clicking file->Download->CSV. But sometimes you need to automate the download. Here’s how.
-

DataDesk: a better way to collect data in African newsrooms
Data collection should not be the preserve of the ’data team‘ – everyone in a newsroom should be able to collect and manage data that helps their reporting.
-

How – and why – we switched from interactive to static data visualisations
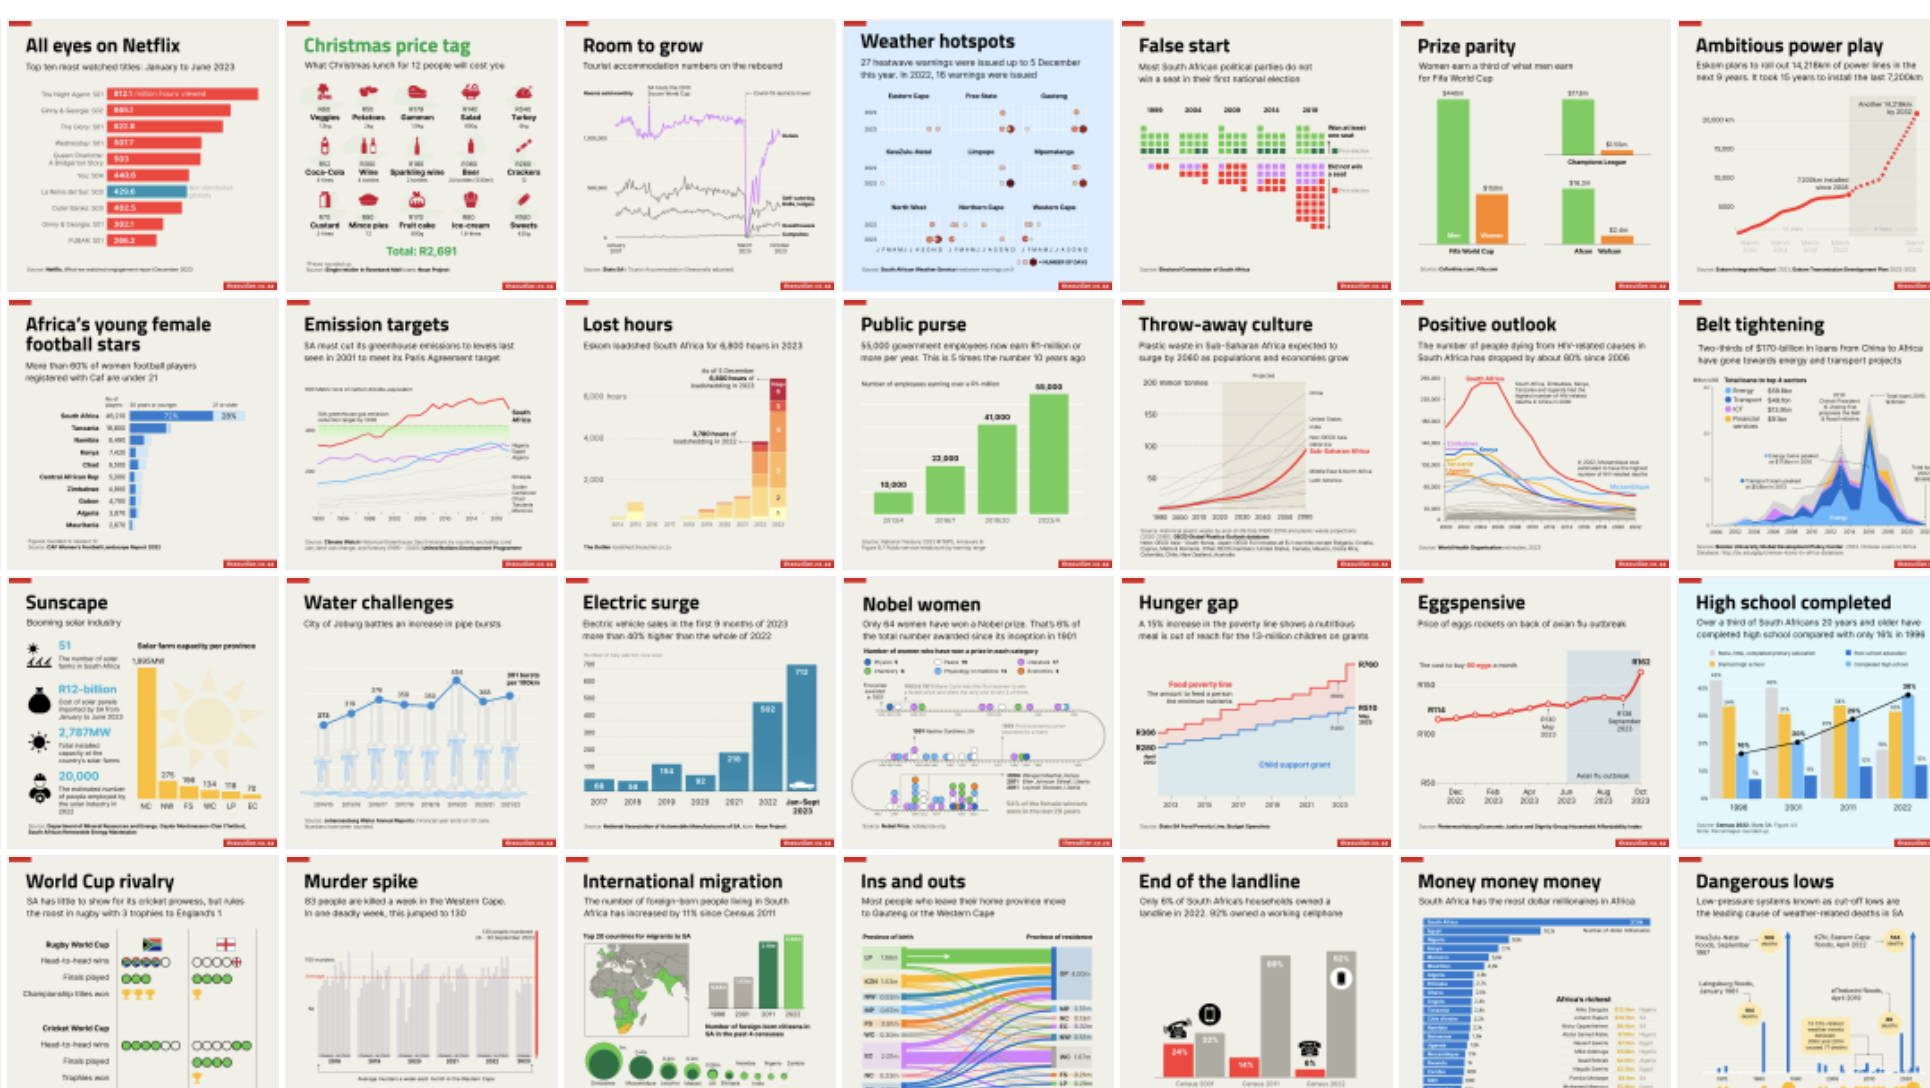
Making the change to static charts with limited options has completely changed the way we think about the visualisations we do. The ’constraints‘ we’ve applied remove a lot of the decision-making usually found in design.
-

A big list of data journalism tools and resources
This list of tools and resources is based on our experience working in data communication. It includes tools that we have used, that we regularly use or know to be useful to anyone looking to perfect their data skills.