Category: The Outlier
-
How Shoprite is outpacing Pick n Pay in almost every race
Two decades ago, two of South Africa’s biggest retailers were almost on a par. We take a look at the metrics to see what has changed since then.
-

Elections24: The funders behind SA’s political parties
One-third of the R437-million in party donations declared to the IEC was made by Durban-born billionaire Martin Moshal and members of the Oppenheimer family.
-

Global TV companies battle for dominance in Africa
The French Canal+ is set to be the top satellite TV provider in Africa, while South Africa’s Showmax and US-based Netflix are facing off in the streaming wars.
-
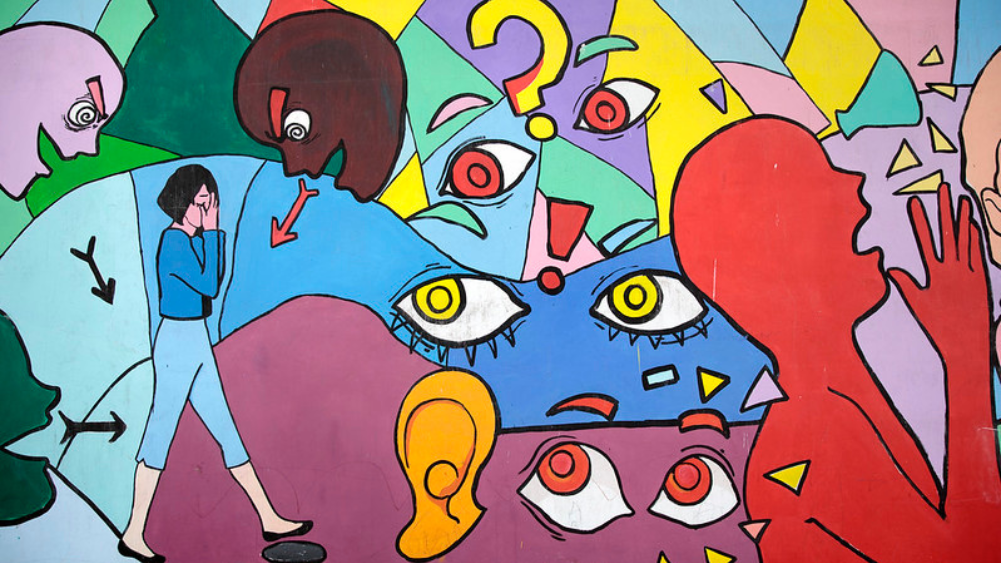
Women murders in SA: Filling in the details
The number of women being killed is rising. Data we’ve collected for the past 5 years gives insight into who these women were and what happened to them.
-
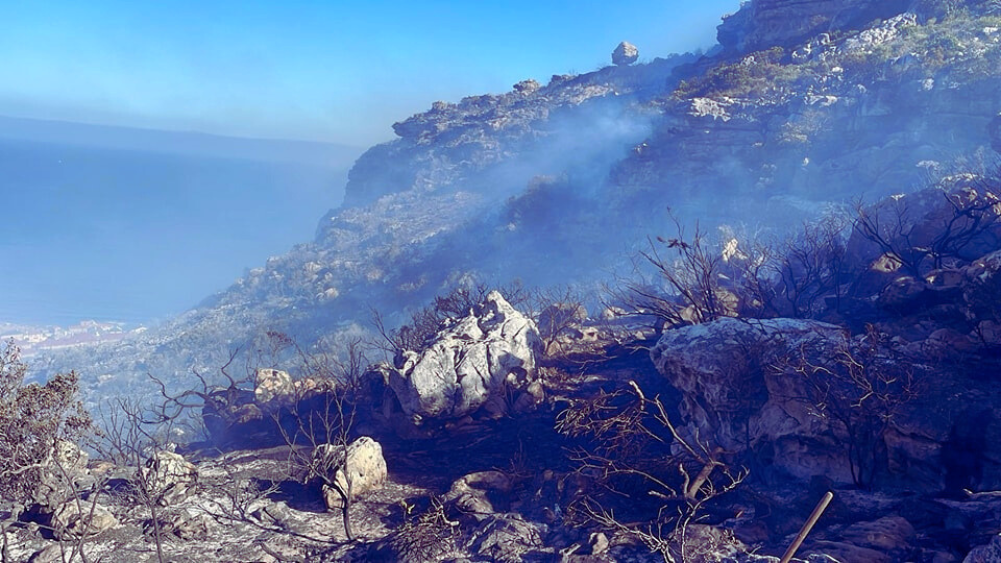
Cape Town’s fire season gets off to an early start
Is this year’s fire season in the mother city much worse than in previous years? We take a look at the data from the past 10 years to find out.
-
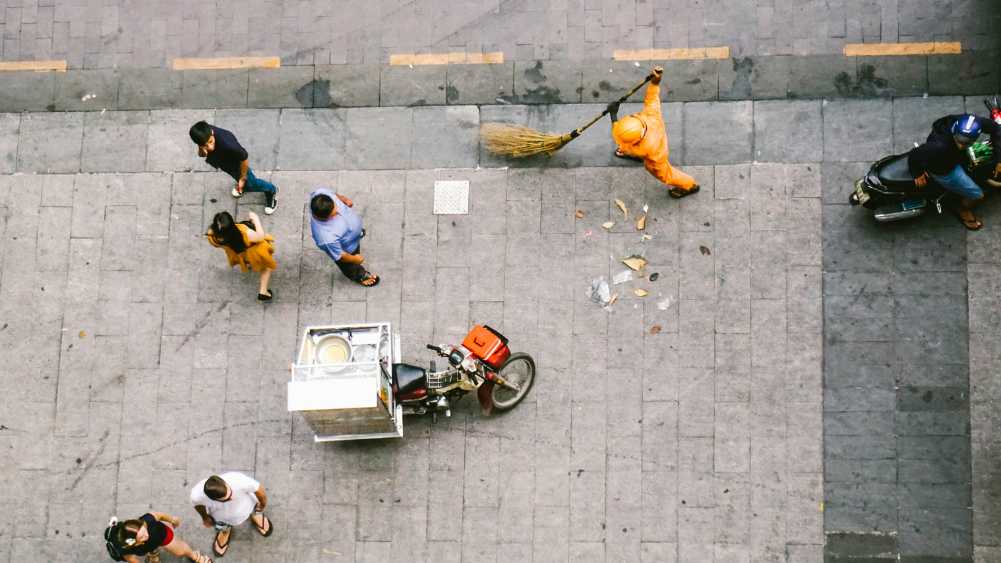
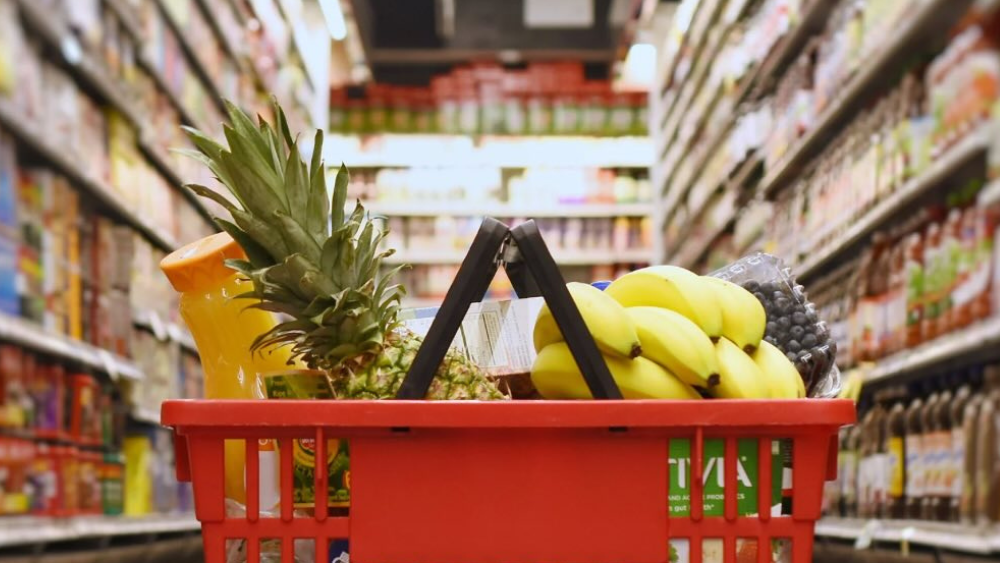
R25.42/hour: Making ends meet on a minimum wage
Paying for basic services such as transport and electricity can swallow up 60% of a minimum wage, leaving about R1,560 for food and other expenses.
-
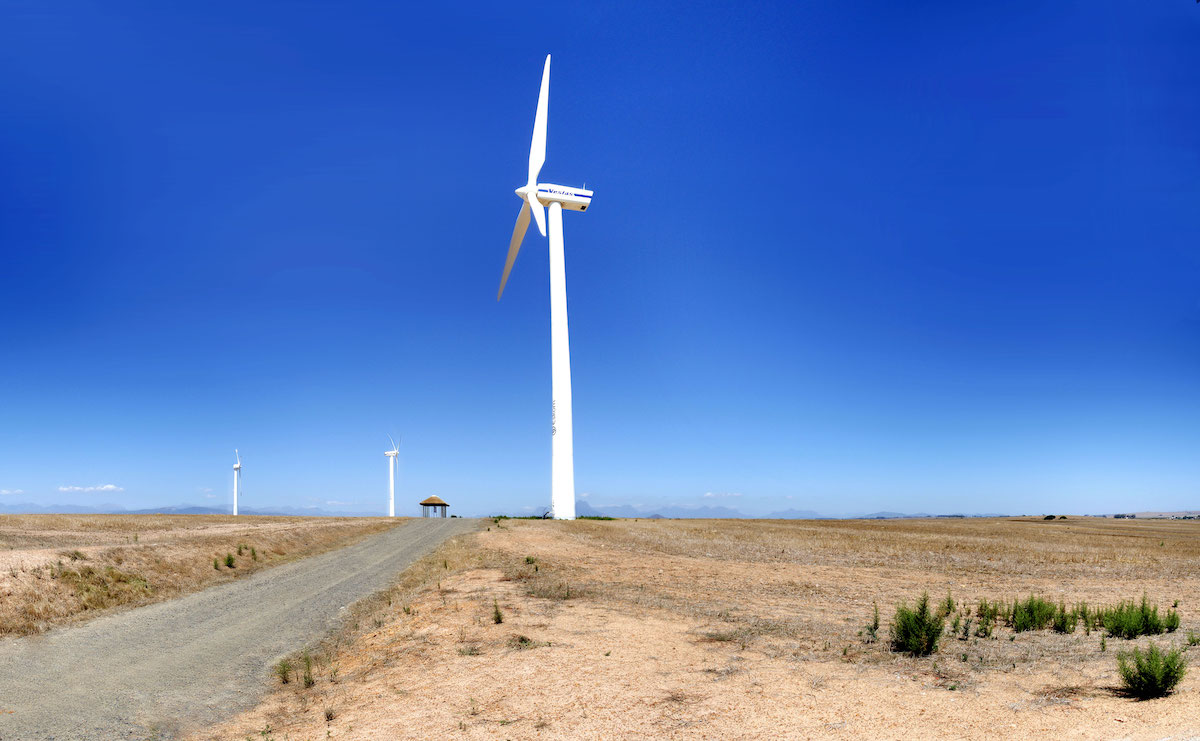
Business takes up the challenge of loadshedding
The majority of the 1,300 energy projects registered with South Africa’s national energy regulator between 2018 and 2023 were below 1MW capacity.
-

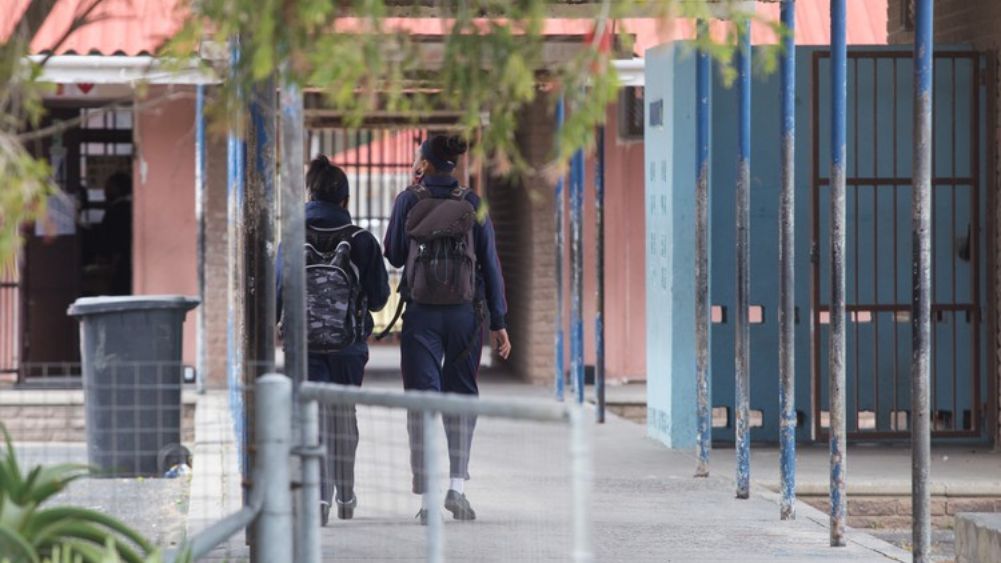
83% matric pass rate, but is SA making the grade?
The class of 2023 recorded the highest matric pass rate since at least 2009. But fewer learners are finishing school and only a third wrote maths.
-
Matric exam data can help uncover the state of education
Outlier Insights is a new project that makes it easy to view and interrogate datasets – such as 13 years of South African matric results.
-
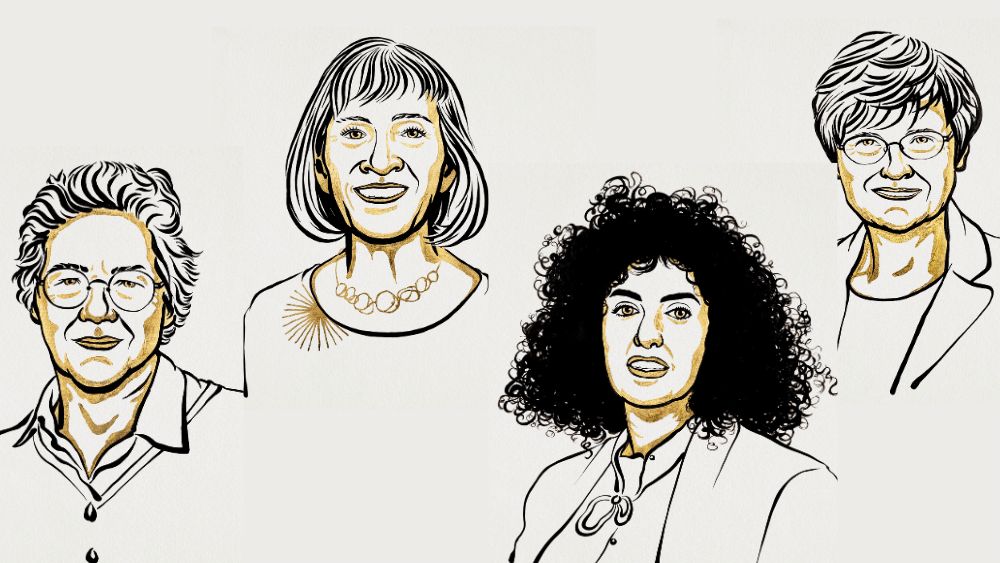
Only 65 of 1,000 Nobel prizes awarded to women
And more than half of them have been in the past 20 years.