Tag: visualisation
-

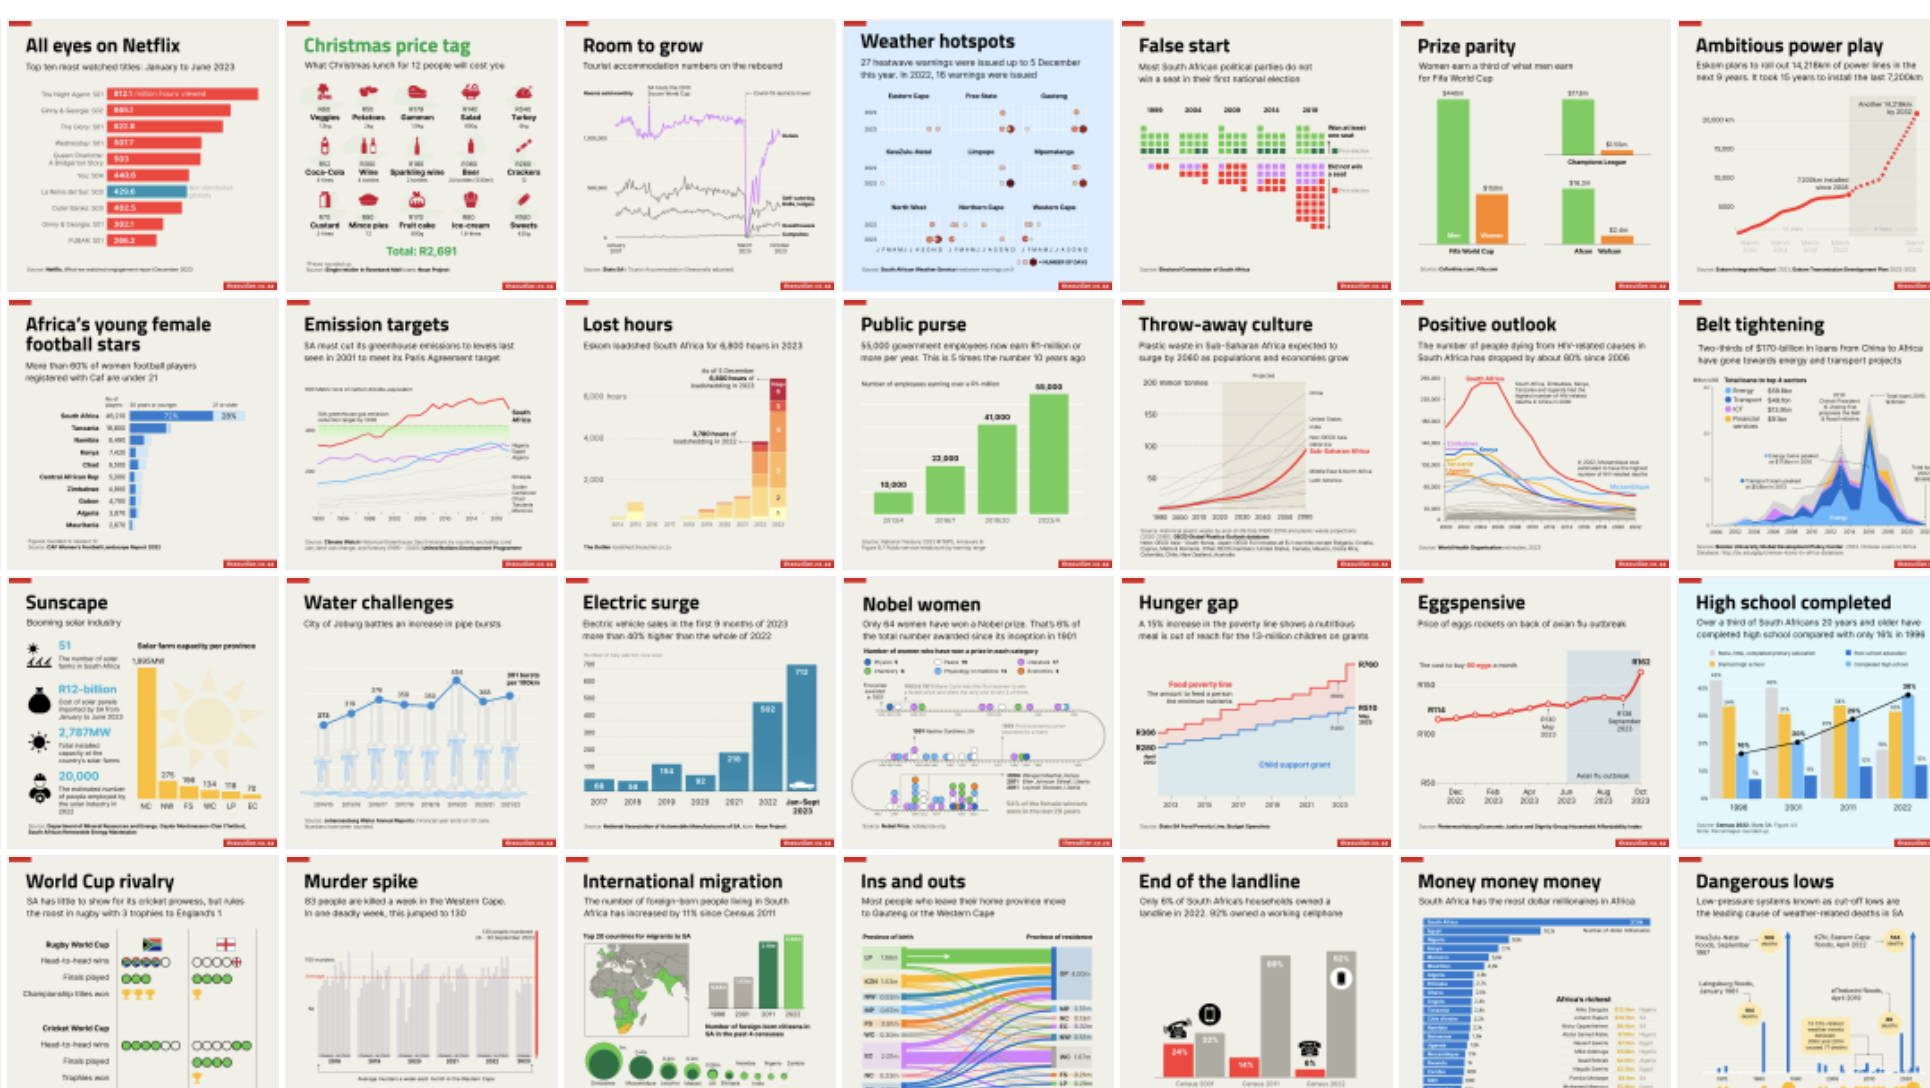
How we create custom charts using Flourish and Figma
At The Outlier we publish a lot of static graphics and we like to apply our own styles. Here’s how we do it using Flourish and Figma.
-

How to extract multiple features from a shapefile in QGIS
This guide will help you find and extract features from a larger map into a smaller one. In this example, selected rivers in South Africa are copied into a new GeoJSON format file.
-
How – and why – we switched from interactive to static data visualisations
Making the change to static charts with limited options has completely changed the way we think about the visualisations we do. The ’constraints‘ we’ve applied remove a lot of the decision-making usually found in design.
-

A big list of data journalism tools and resources
This list of tools and resources is based on our experience working in data communication. It includes tools that we have used, that we regularly use or know to be useful to anyone looking to perfect their data skills.