🌍 Amid the clamour of Trump’s renaming of everything that passes within his ambit Africa also had a moment. Last week the UN voted to adopt a more visually honest world map, replacing the familiar Mercator map with the Equal Earth version, in which Africa is no longer presented similar in size to Greenland when, in reality, it is more than 10 times larger, for example. We made an interactive map to visualise the difference.
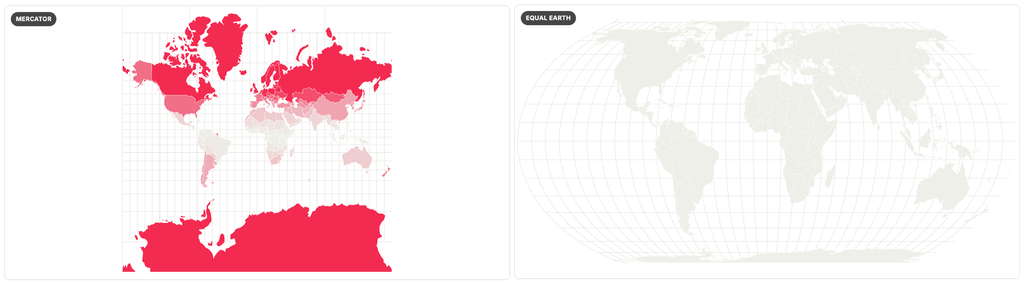
The US was the only vote against the motion, declaring that this move was “superfluous”. Granted, a new and unfamiliar map does little to change decades of ingrained perception, even among Africans, about the position and influence of the continent in world affairs, but the rehabilitation of perceptions of Africa’s true position in the world continues. Here’s how we’re getting on with that…
🏫 Class struggle
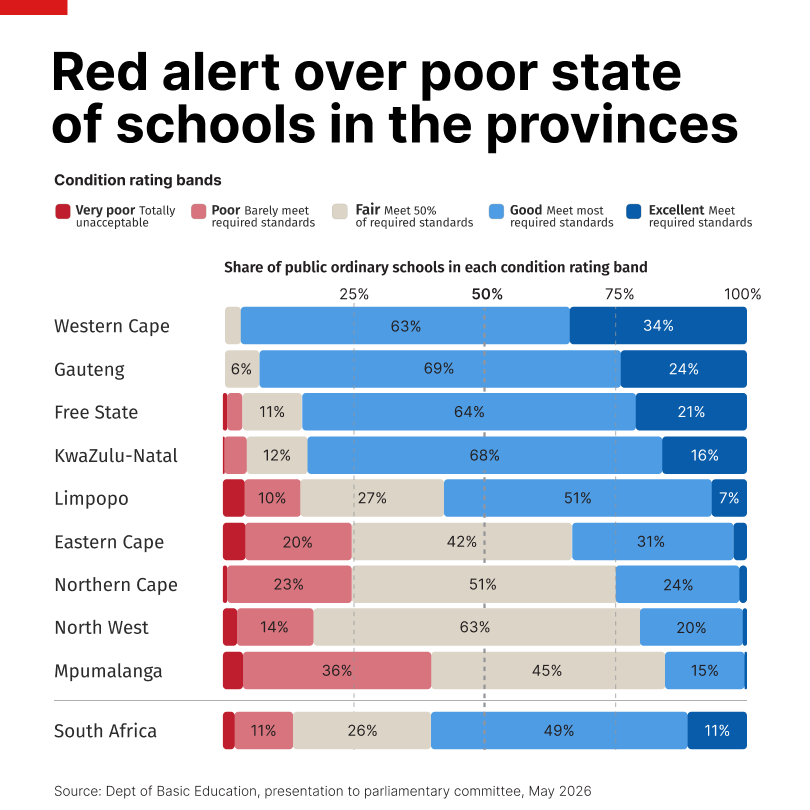
South African schools are graded by the provincial departments of education according to how well they are able to serve the needs of leaners. This includes mostly the physical infrastructure, from buildings and sanitation to electricity supply and security.
At a glance 60% of schools appear to be in good or excellent condition, but these schools are heavily concentrated in the Western Cape, Gauteng, Free State, Limpopo and KZN, while in the remaining provinces the majority of schools are rated far lower.
According to the education department, a school in “fair” condition meets about half of the required standards. In North West, two-thirds of the schools only partially serve their intended purpose, while in Mpumalanga this rises to 85%.
🙏 Produced in partnership with The Education Desk
💡 If you’re interested in schools with pit toilets, The Outlier has been keeping track of the schools that have been listed as a SAFE Initiative school by the DBE as well as other schools that are reported to have pit toilets on an interactive map here.
SECTION27’s Michael Komape Sanitation Progress Monitor has been tracking the progress made by the Limpopo Department of Education on upgrading schools sanitation at schools with pit toilets since 2021.
🗞️ News break
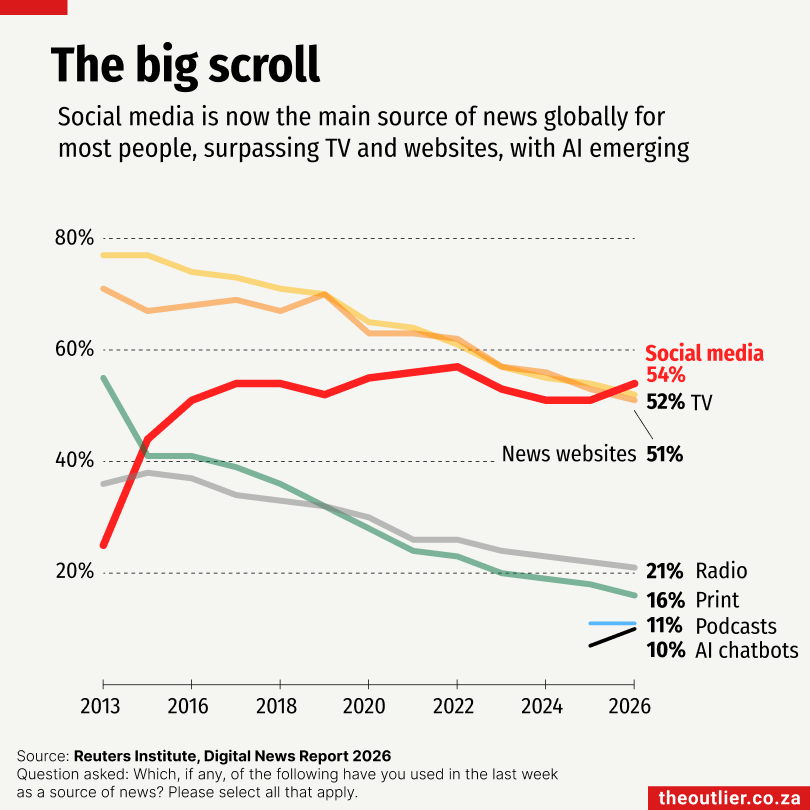
Research from the Oxford University-based Reuters Institute shows that most people now get their news from social media.
What is startling is the drop off in usage of other news sources. TV has steadily declined from 77% in 2013 to just 52% today, and news websites have dropped from nearly 80% to 51%.
Unsurprisingly print media continues to plummet, currently at just 16% from 55% in 2013. As someone who has worked in print journalism I always knew that print was on the decline, I just hadn’t realise that it had been well over a decade since social media surpassed print as a source for news.
The silent killer?
But sometimes it’s not the big numbers of the chart we need to pay attention to, but the small ones.
AI chatbots strike fear into the hearts of traditional media organisations. Although it’s used by just 10% of those surveyed, it’s clearly on the rise as more users look for answers from AI tools, and not just news but facts derived from news. And this is presented as complete information upfront so you don’t have to click through to news websites at all.
🗳️ Count down
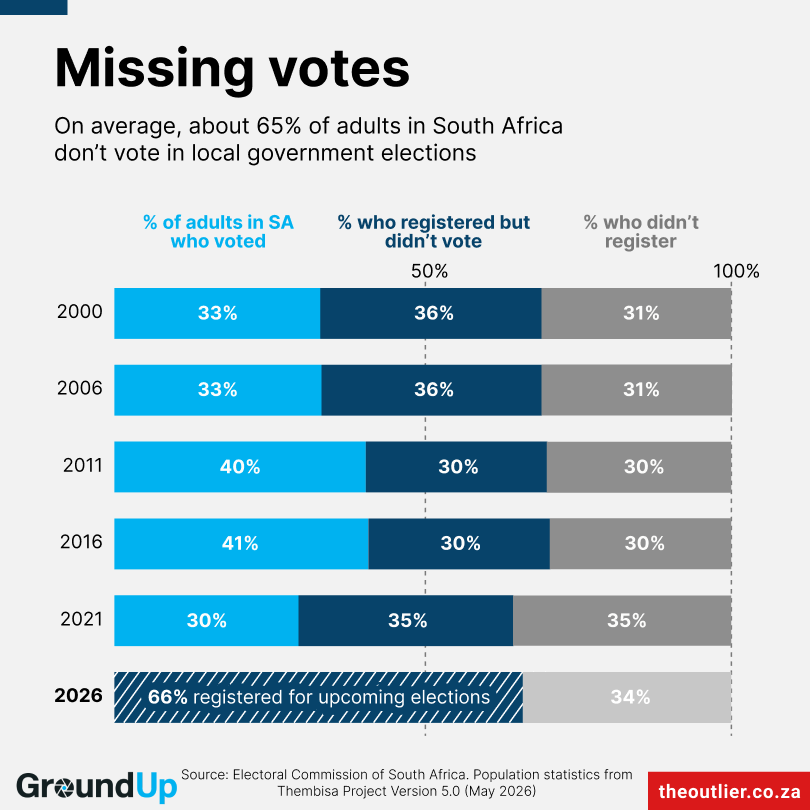
About two-thirds of adults in South Africa don’t vote in local government elections.
2021 saw the lowest registration rates and turnout for local elections held since 2000. Only 30% of adults voted, while 35% were registered but didn’t vote, and 35% weren’t registered.
About 2.1-million people have registered since the 2024 general election, but when taking into account the growth in the adult population, the proportion of registered adults has barely grown. 66% of adults in South Africa are registered for the upcoming local government elections.
To calculate this, we used the IEC’s voters’ roll and the Thembisa Model’s projections for the voting-age population. The Thembisa Model estimates include non-South Africans who live in the country and who would not be eligible to vote, but this is a relatively small proportion of the population.
The voters’ roll is also ageing. About 31% of 18 to 19-year-olds and 45% of 20 to 29-year-olds are registered, while 61% of people in their 30s, 72% in their 40s, 85% in their 50s, and 92% in their 60s are registered.
🙏 Produced in partnership with GroundUp News. Read the full story.

🐕 Pet patrol
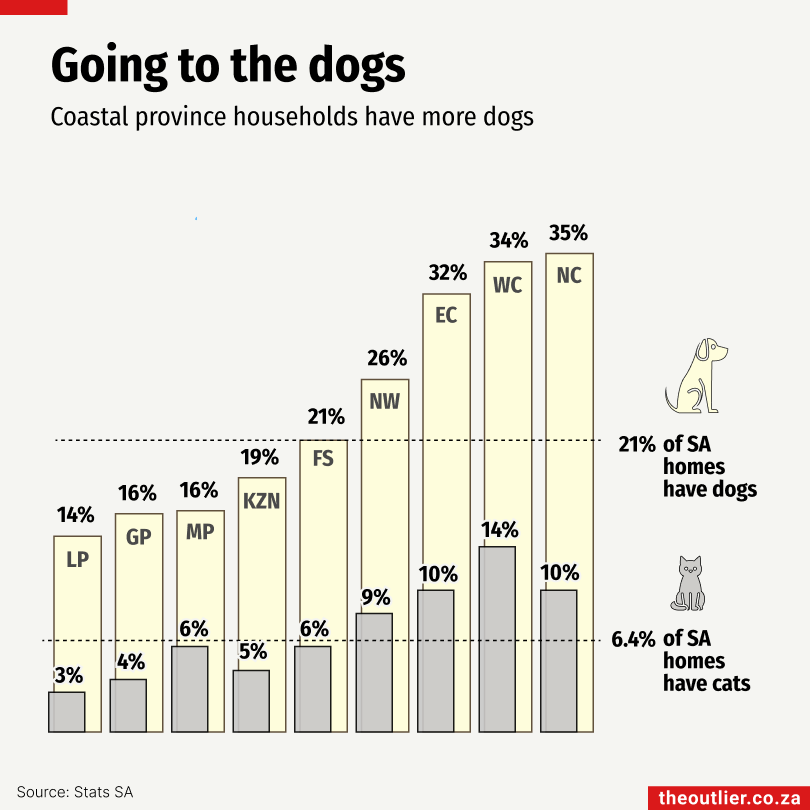
The Cape provinces are dog country. So says Stats SA’s 2025 general household survey.
In the Northern Cape 34.7% of households have dogs. In the Western Cape it is 34.1%. In the Eastern Cape 31.8%. Together with the Free State and North West these provinces are all above the national average for dog ownership which is 21% of households.
Dogs are clearly more popular than cats. Only 6.4% of households have a cat, but you are more likely to have a cat if you also have a dog.
The higher than average number of dogs in the Western Cape is also interesting given this week’s kerfuffle about the City of Cape Town’s new proposed bylaws for animal keeping, which doesn’t change the number of animals households can have but does enforce stricter microchipping and leash laws. The main sticking point is the introduction of permits for keeping either dogs or cats.
By the numbers
R159-billion
Total ecommerce spend in South Africa, now reflecting 10% of all retail turnover. The R30-billion increase over 2025 spend equals South Africa’s total online spend in 2020.
R2.2-billion
The value of the Springboks, in strictly monetary terms. This has doubled in the last few years with sponsorship money (FNB, Pick ‘n Pay etc) surpassing the broadcasting rights fees for the first time ever.
US$2-billion
The cost to develop the highly anticipated Grand Theft Auto VI game. When it launches in November, it will be the most expensive video game ever produced. It’s preview clip was the most watched Netflix video in August.