Tag: charts
-

-

7 chart tips for faster, clearer data storytelling
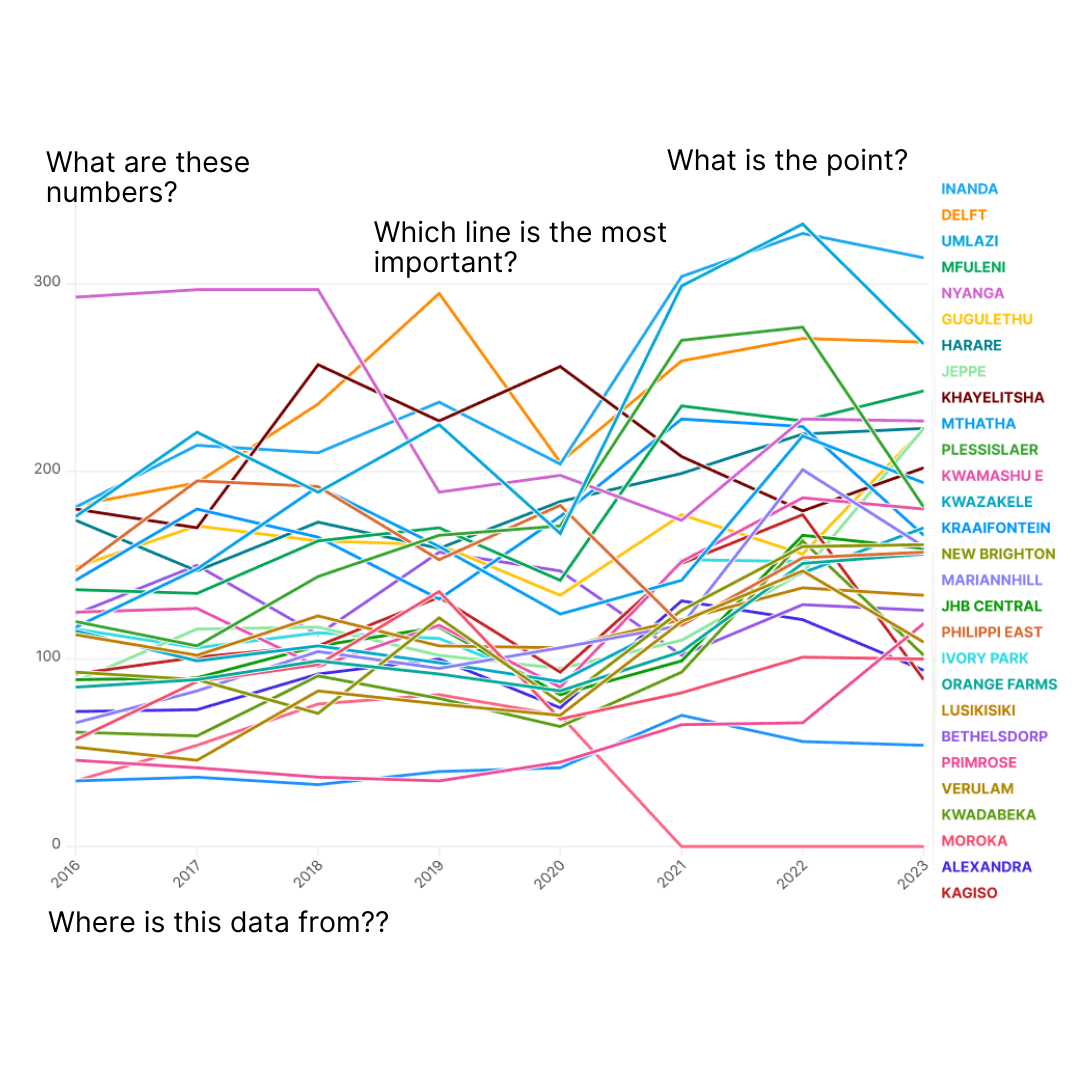
A great chart delivers insight instantly, helping readers understand complex stories in seconds. When done well, charts aren’t just a supplement: they are journalism, in a more visual form.
-
2024: The Outlier’s Year in Review
It’s been a huge year for training for us at The Outlier. We’ve run our in-person Data Storytelling workshop more than a dozen times, training close to 150 people.
-

-

The tools we use to make our charts and dashboards
We often get asked what tools power the hundreds of charts and dashboards we produce at The Outlier. From data crunching in Google Sheets to designing with Flourish and Figma, we’ve fine-tuned a process for creating both static and interactive visuals. Our special data deep dives are built with Svelte and D3.js to help bring…
-

South Africa’s energy shift: How the just transition is shaping the future
As the world races to embrace new technologies to avert climate disaster, South Africa is rolling out a plan to ensure its energy transition doesn’t leave communities or workers behind. With global goals to reduce greenhouse gas emissions by 45% by 2030 and reach net zero by 2050, scaling up clean energy sectors has become…