Tag: dataviz
-

-

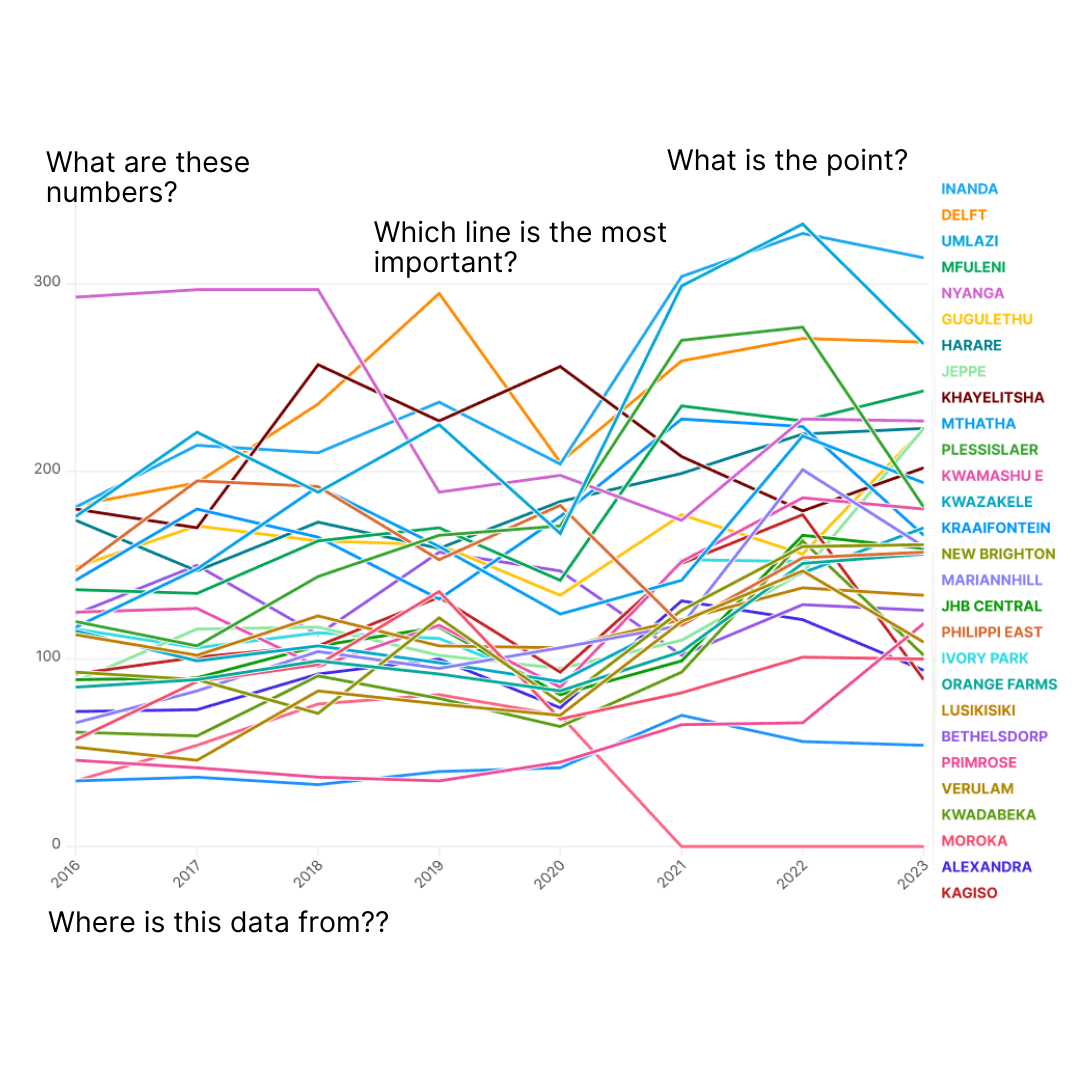
7 chart tips for faster, clearer data storytelling
A great chart delivers insight instantly, helping readers understand complex stories in seconds. When done well, charts aren’t just a supplement: they are journalism, in a more visual form.
-
Outlier favourites: 8 charts that hit the mark in 2024
There are more than 650 charts in the Our World In Charts collection, 200+ of which have been produced during the course of 2024. Here are eight charts selected by members of The Outlier’s team as standout examples of the work we’ve covered this year.
-

-

The tools we use to make our charts and dashboards
We often get asked what tools power the hundreds of charts and dashboards we produce at The Outlier. From data crunching in Google Sheets to designing with Flourish and Figma, we’ve fine-tuned a process for creating both static and interactive visuals. Our special data deep dives are built with Svelte and D3.js to help bring…