Category: The Outlier
-
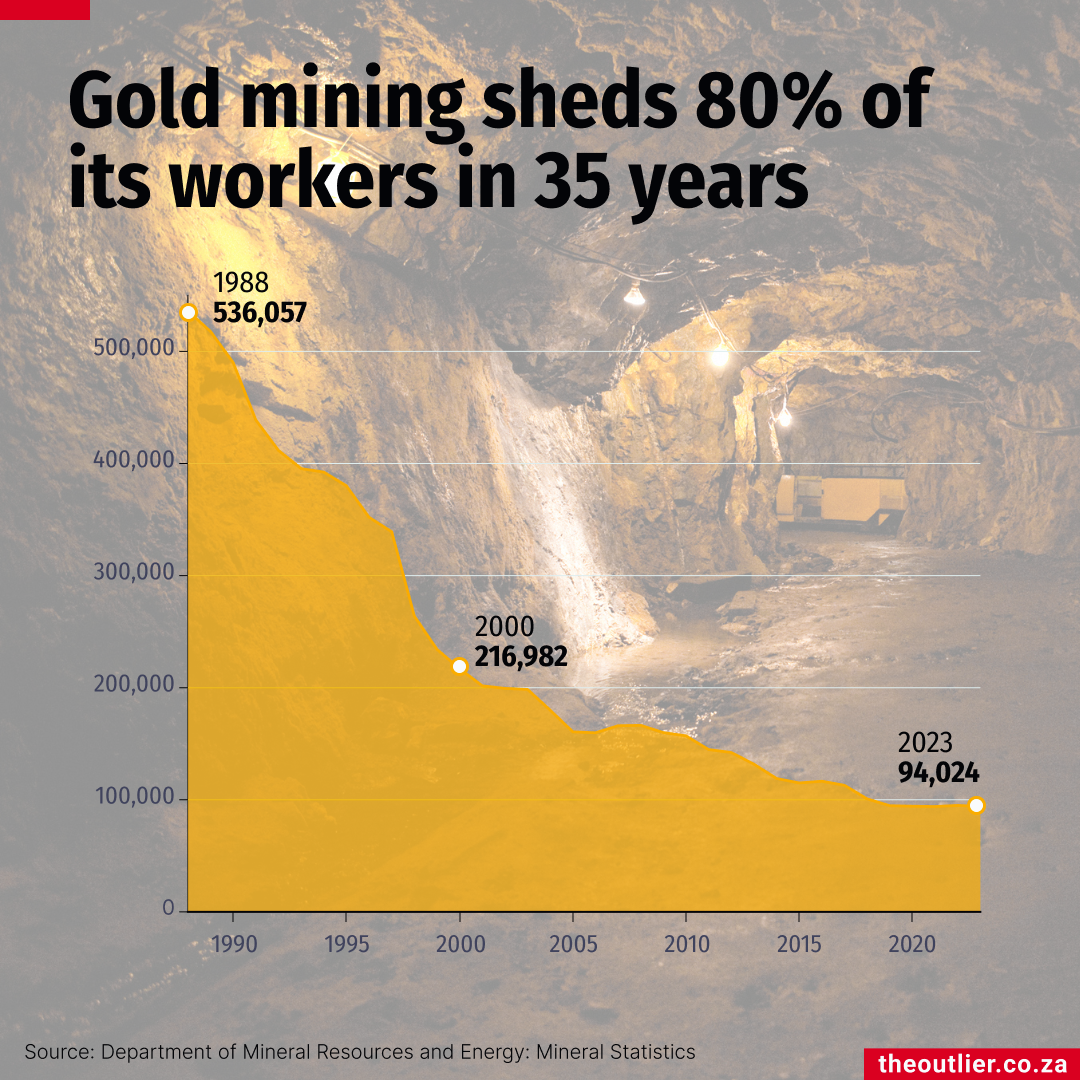
Illegal mining on the rise as SA’s gold industry collapses
South Africa’s mining fatalities hit a record low in 2024, but illegal mining is fast becoming a crisis for the industry. As gold mines shut down, informal miners – known as zama zamas – risk their lives extracting residual gold under dangerous conditions.
-
-

-
-

-

-
-

7 chart tips for faster, clearer data storytelling
A great chart delivers insight instantly, helping readers understand complex stories in seconds. When done well, charts aren’t just a supplement: they are journalism, in a more visual form.
-
-